The reaction caught me completely off-guard.
On September 6th, the USD ISM Non-Manufacturing/Services Composite for August came in at 51.3, well below “expectations” of 54.9 and the lowest reading since February, 2010. The reaction was swift in financial markets. The 30-day Fed Fund futures pushed out the next rate hike from December, 2016 (54.2%) to March, 2017 (53.6%).
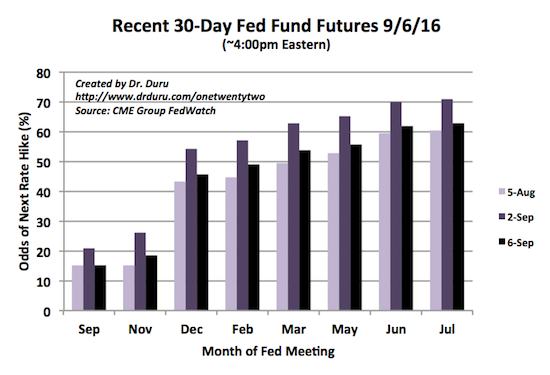
Futures market push out the next rate hike to February, 2017.
Currency markets received the memo and responded quickly. The U.S. dollar index (DXY0) plunged 1.1% and returned to its level right before the Jackson Hole economic symposium.
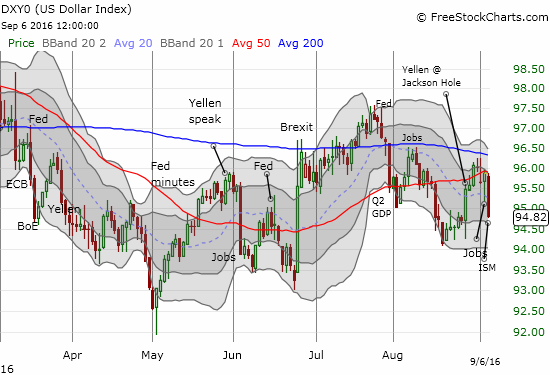
A smackdown for the U.S. dollar index as resistance around the 50-day moving average (DMA) seems to hold. The Jackson Hole gains are almost all gone now.
Precious metals were of course big winners as the dollar fell flat on its face. The SPDR Gold Shares (NYSE:GLD) gained 1.7% and the iShares Silver Trust (NYSE:SLV) gained 2.8%. SLV managed to gap up above its 50DMA before the ISM release, so I was already repositioned in SLV call options before the additional surge upward.
This trade followed the strategy I laid out in my last T2108 Update. It was a timely move as the September $19 call options that I bought near the open almost doubled in value by the close of trading.
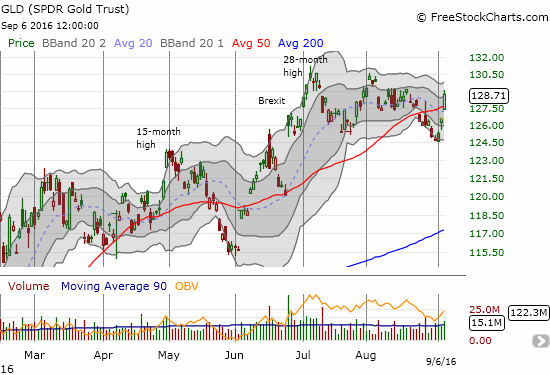
The SPDR Gold Shares (GLD) challenges its topping pattern with a surge above its 50DMA
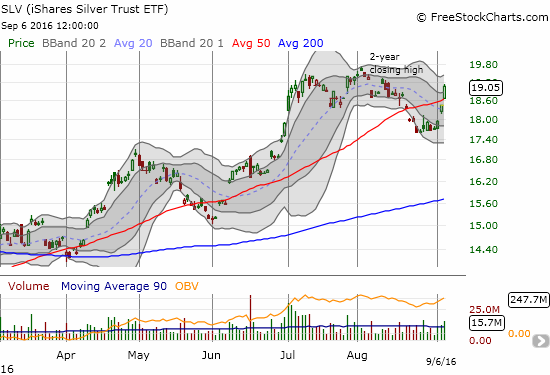
The iShares Silver Trust (SLV) makes a bid for a new 2-month high as it punches above its 50DMA
For some time now, I have been straining and straining to see the topping pattern in GLD. Every time it seems all the technical, sentiment, and fundamental factors have lined up, something comes along to give GLD new life. After Friday’s jobs report, I thought it was strange that gold and silver managed gains even as the U.S. dollar index gained as well. I think Tuesday's moves resolved that mini-paradox.
Tuesday's move has also finally solidified my sympathies for gold and silver bulls (note I have long maintained core long positions in GLD and SLV as portfolio hedges). Instead of looking for buyers to prove the bull case, I should be looking for sellers to prove the bear case.
Since GLD began its huge 2016 rally from 6-year lows, it has bounced back from two 50DMA breakdowns. Those milestones signify resilience. SLV has bounced back from three 50DMA breakdowns and held support at its 200DMA along the way.
The burden of proof is clearly on the sellers and bears, NOT the buyers and bulls. My solidified sympathies are putting me back in the “buy-the-dip” mode. Just as I prefer to fade volatility ahead of Federal Reserve meetings, I see a need to buy gold and silver trades whenever they waver because of rate hike talk, rate hike fears, Fedspeak, economic news, U.S. dollar rallies, etc…
The path of least resistance is up until proven otherwise. Every time the pendulum completes another cycle, another rate hike from the Fed seems more remote.
Interestingly, the Japanese yen (FXY) was the biggest beneficiary of the ruckus among currencies. The recent upward momentum in USD/JPY came to an abrupt and sudden end as the currency pair plunged to around 101.4. The CurrencyShares Japanese Yen ETF (NYSE:FXY) soared back above its 50DMA with a 2.0% gain.
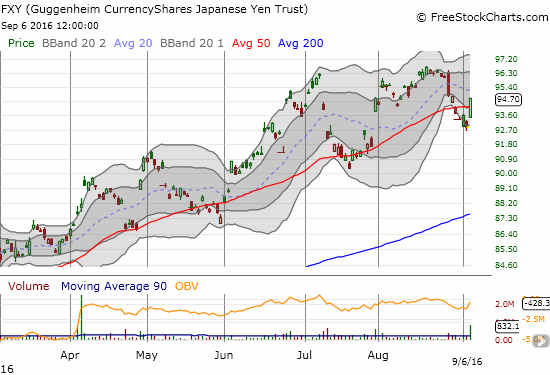
The CurrencyShares Japanese Yen ETF (FXY) makes a fresh bid to retain its uptrend as it closes above its 50DMA again.
I forgot to mention in the last T2108 Update that I sold my last tranche of FXY put options just ahead of the jobs report. I did not want to risk a soft report taking down my position and wiping out profits with expiration just two weeks away at the time.
FXY gapped down for its third trip in a row below its lower-Bollinger Band (BB). Such a move is typically short-term over-extended, so it seemed like a good time to close out my trade and take profits. As the chart above shows, I sold just in time for that day, but FXY managed to gap down in response to what was interpreted as a weaker-than-expected jobs report.
I almost bought FXY put options in the face of Tuesday's raly, but I decided to just wait and be patient. A full reversal of recent losses seems in the cards, so letting that process play out seems prudent. I have decided I want to be short by the time of the Bank of Japan’s (BoJ) meeting on September 20th and 21st. I still expect the September $97 call option I bought earlier as a hedge to expire worthless.
In the meantime I am licking wounds on my net long U.S. dollar positions. I am not changing the currency strategy just yet. In fact, I think the dollar’s one-day loss was an over-reaction at least in scale and scope. As a result, I took a speculative long position in USD/CAD to play at least a partial reversal that assumes USD/CAD remains caught in a trading range.
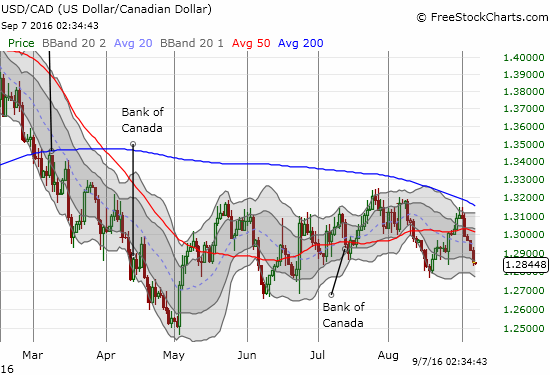
USD/CAD trades back to the bottom of an extended trading range.
Full disclosure: long GLD, SLV shares; long SLV call option, net long U.S. dollar
