
Franklin Resources (NYSE:BEN) has announced preliminary assets under management (AUM) by its subsidiaries of $678.3 billion for January 2019. Results display 4.4% rise from $649.9 billion recorded as of Dec 31, 2018. Net market gains, partially offset by net outflows, led to the increase. However, the figure dipped 12% from the previous year.
Month-end total equity assets came in at $281.2 billion, up 6.9% from the previous month, but down 15.7% year over year. Of the total equity assets, around 63% were from international sources, while the remaining 37% came in from the United States.
Total fixed income assets were $256.2 billion, up 1.7% from the last month, but down 10.1% from last year. Overall, tax-free assets accounted for only 24% of the fixed-income assets, while the remaining 76% was taxable.
Franklin recorded $131.2 billion in hybrid assets, which was up 5.1% from $124.8 billion witnessed in the previous month, but down 9.8% from $145.4 billion reported in January 2018.
Cash management funds came in at $9.7 billion, down from the prior-month figure of $10.1 billion, but up from the year-ago tally of $6.8 billion.
The company’s global footprint is an exceptionally favorable strategic point as its AUM is well diversified. Nevertheless, regulatory restrictions and sluggish economic recovery might mar AUM growth, and escalate costs.
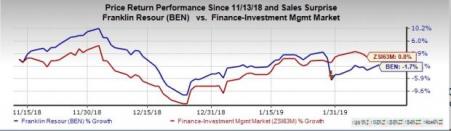
Currently, Franklin carries a Zacks Rank #5 (Strong Sell). Shares of the company have lost around 1.7% over the last three months, as against the 0.8% gained recorded by the industry.
You can see the complete list of today’s Zacks #1 Rank (Strong Buy) stocks here.
Among other asset managers, Invesco Ltd.’s (NYSE:IVZ) AUM as of Jan 31, 2019, came in at $930.6 billion, up nearly 4.8% from the previous month. Favorable market returns, higher money market AUM and reinvested distributions were primary reasons behind the rise in total AUM. Moreover, foreign exchange boosted the month’s AUM by $4.9 billion. However, these were partially offset by net long-term outflows and non-management fee earning AUM outflows.
Further, T. Rowe Price Group, Inc. (NASDAQ:TROW) and Legg Mason Inc. (NYSE:LM) are expected to release preliminary AUM results for January 2019, later this week.
Zacks' Best Stock-Picking Strategy
It's hard to believe, even for us at Zacks. But from 2000-2018, while the market gained +4.8% per year, our top stock-picking strategy averaged +54.3% per year.
How has that screen done lately? From 2017-2018, it sextupled the market's +15.8% gain with a soaring +98.3% return.
Free – See the Stocks It Turned Up for Today >>
Franklin Resources, Inc. (BEN): Get Free Report
Invesco Ltd. (IVZ): Get Free Report
T. Rowe Price Group, Inc. (TROW): Get Free Report
Legg Mason, Inc. (LM): Get Free Report
Original post
Zacks Investment Research