In this article, we revise our tentative pricing model for Franklin Resources (BEN) presented on March 18, 2012. According to Yahoo.com “The firm provides its services to individuals, institutions, pension plans, trusts, and partnerships. It manages, through its subsidiary, separate client-focused equity, fixed income, and balanced portfolios.” BEN is a financial company and we analyzed it three years ago as a candidate for bankruptcy. (Unlike Lehman Brothers, Freddie Mac, Fannie Mae and many other financial companies, Franklin Resources has never been near the zero line of share price.) In March 2012, our quantitative model, which foresaw the evolution at a five month horizon, signaled a negative correction to BEN’s share price. We expected that the price would likely fall in the second quarter of 2012 and then would stay at $105 in 2012Q2. In February 2012, the monthly closing (adjusted for splits and dividends) price was at the level of $117.07, in March - $123.44, and in April - $124.91 (all readings are sourced from Yahoo! Finance).
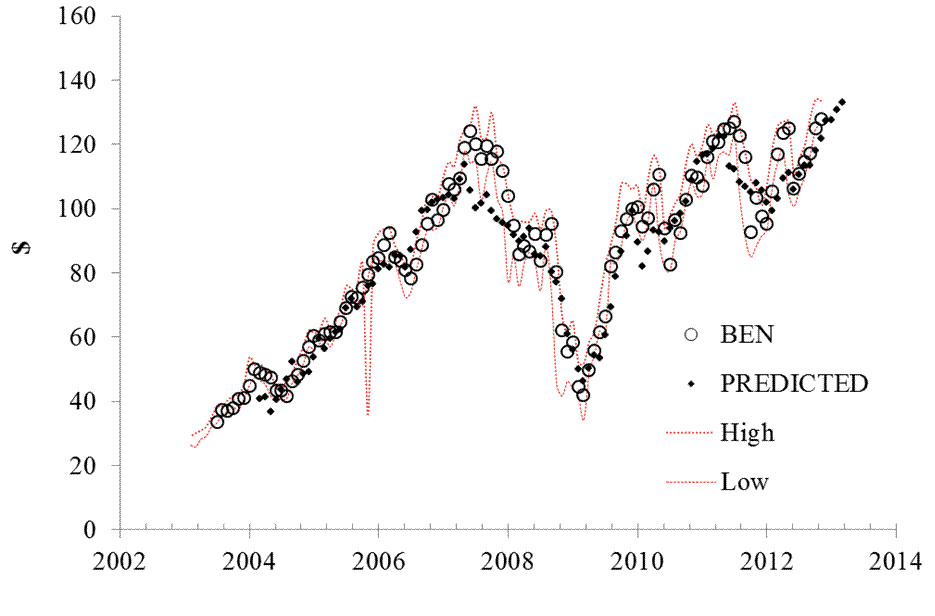
After a large negative correction in May the price fell to $106.28 and was $110 in June. Therefore, the prediction was strikingly accurate in time and size. The revised model based on the monthly closing prices through October 2012 and consumer price indices available for the same period, shows a possibility of a further increase in the price at a four months horizon. The price is expected to rise to $134 in January 2012 with the current (Nov. 23) level of $133.18. This means that BEN’s price has reached its January’s level and may stall at the current level. After a six month period of fast growth (from $106 to $133) and the above market return (~20%) the probability of the growth extension into 2013 cannot be high. One should not exclude that now is the best time to fix profit.
We presume that any share price can be represented as a weighted sum of two consumer price indices (not seasonally adjusted in our model) which may be leading the share price by several months. Our model also includes a linear time trend and an intercept in order to remove mean and trend components from all involved time series. The intuition behind our pricing model is obvious – we link a given share to those goods and services which are produced/provided by the company. In order to provide a dynamic reference we also introduce in the model some relative and independent level of prices (also expressed by CPIs). Hence, one needs two different CPIs to define the model. These CPIs we select from a big set of 92 CPIs by minimizing the residual model error.
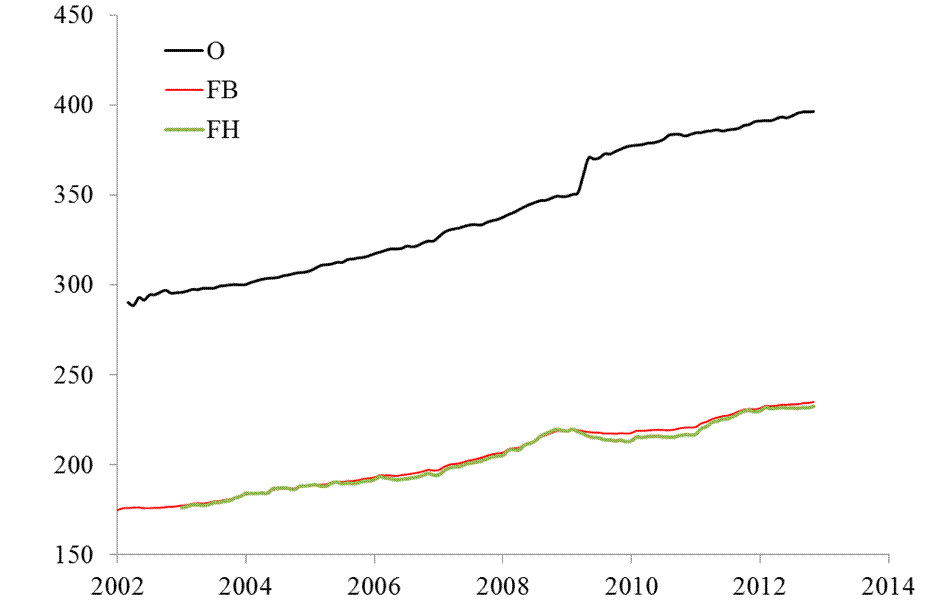
In March 2012, the tentative model was driven by the consumer price index of food at home, FH, leading the price by five months and the index of other goods and services, O, which led by nine months. In the revised model, the former index is replaced by the index of food without beverages, FB, which leads the share price by four months. Both food related indices are very close, as Figure 1 shows. The tentative and revised pricing models are as follows:
BEN(t) = -5.47FH(t-5) – 1.81O(t-9) – 59.55(t-2000) + 1327.36, February 2012
BEN(t) = -7.33FB(t-4) – 1.52O(t-9) – 69.58(t-2000) + 1536.22, October 2012
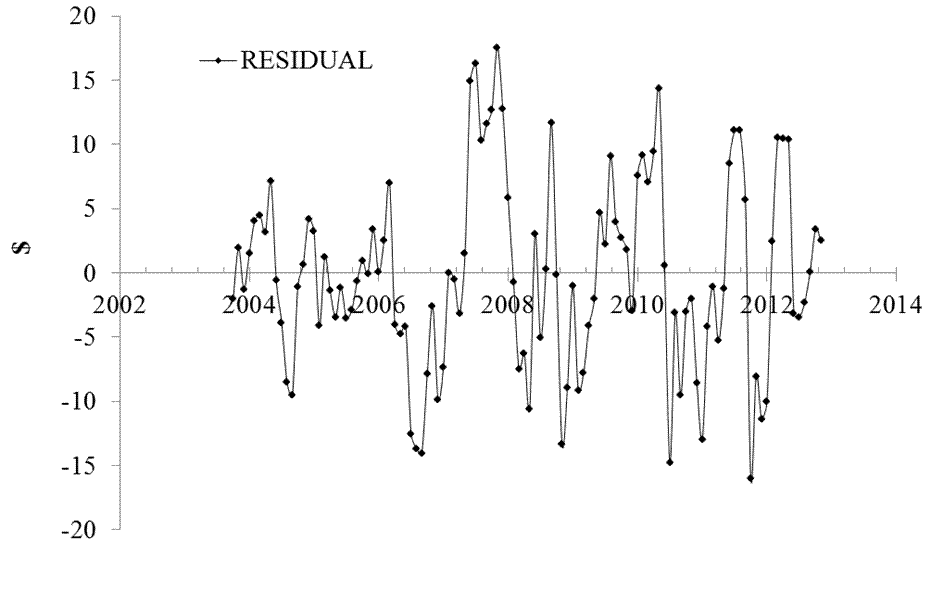
where t is calendar time. The standard error between July 2003 and October 2012 is $7.36 ($7.55 in March).
Figure 2 depicts the observed and predicted monthly closing prices since 2003 and also provides the high/low monthly prices, which may serve as the estimates of uncertainty in the monthly price. (One can model the monthly high or low price instead of the closing one.) At a four month horizon, the price is expected to grow to the final level of $134. Figure 3 shows that BEN’s price is currently very close to the predicted one.


- English (UK)
- English (India)
- English (Canada)
- English (Australia)
- English (South Africa)
- English (Philippines)
- English (Nigeria)
- Deutsch
- Español (España)
- Español (México)
- Français
- Italiano
- Nederlands
- Português (Portugal)
- Polski
- Português (Brasil)
- Русский
- Türkçe
- العربية
- Ελληνικά
- Svenska
- Suomi
- עברית
- 日本語
- 한국어
- 简体中文
- 繁體中文
- Bahasa Indonesia
- Bahasa Melayu
- ไทย
- Tiếng Việt
- हिंदी
Franklin Resources' Rally May Come To End
Published 11/25/2012, 03:56 AM
Updated 07/09/2023, 06:31 AM
Franklin Resources' Rally May Come To End
Latest comments
Loading next article…
Install Our App
Risk Disclosure: Trading in financial instruments and/or cryptocurrencies involves high risks including the risk of losing some, or all, of your investment amount, and may not be suitable for all investors. Prices of cryptocurrencies are extremely volatile and may be affected by external factors such as financial, regulatory or political events. Trading on margin increases the financial risks.
Before deciding to trade in financial instrument or cryptocurrencies you should be fully informed of the risks and costs associated with trading the financial markets, carefully consider your investment objectives, level of experience, and risk appetite, and seek professional advice where needed.
Fusion Media would like to remind you that the data contained in this website is not necessarily real-time nor accurate. The data and prices on the website are not necessarily provided by any market or exchange, but may be provided by market makers, and so prices may not be accurate and may differ from the actual price at any given market, meaning prices are indicative and not appropriate for trading purposes. Fusion Media and any provider of the data contained in this website will not accept liability for any loss or damage as a result of your trading, or your reliance on the information contained within this website.
It is prohibited to use, store, reproduce, display, modify, transmit or distribute the data contained in this website without the explicit prior written permission of Fusion Media and/or the data provider. All intellectual property rights are reserved by the providers and/or the exchange providing the data contained in this website.
Fusion Media may be compensated by the advertisers that appear on the website, based on your interaction with the advertisements or advertisers.
© 2007-2025 - Fusion Media Limited. All Rights Reserved.
