
Franco-Nevada Corporation (TO:FNV) delivered adjusted earnings of $44.7 million or 24 cents per share in fourth-quarter 2018, down from the $52.1 million or 28 cents per share reported in the prior-year quarter. In addition, the EPS figure marginally missed the Zacks Consensus Estimate of 26 cents.
The company generated revenues of $148.2 million in the reported quarter, down 11.4% year over year. The revenue figure also lagged the Zacks Consensus Estimate of $162 million. In the fourth quarter, 87.7% of the revenues were sourced from gold and gold equivalents (66.3% gold, 10.9% silver, 7.6% platinum group metals and 2.9% other mining assets) and 12.3% from energy (oil, gas and natural gas liquids).
The company sold 104,877 Gold Equivalent Ounces (GEOs) in the quarter, down 12.5% from 119,839 GEOs in the prior-year quarter.
In the Dec-end quarter, adjusted EBITDA was $118.7 million, down 7.3% from $128.0 million witnessed in the comparable period last year.
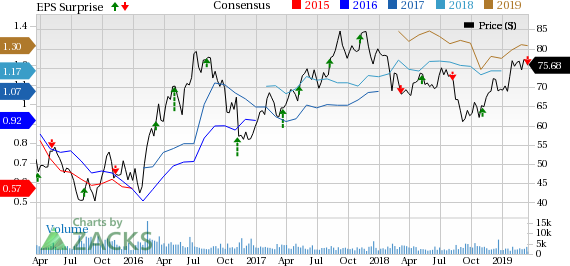
Franco-Nevada Corporation Price, Consensus and EPS Surprise
Prices
At the end of the Oct-Dec quarter, average gold price was $1,228 per ounce, approximately 3.6% lower than the year-ago quarter. Silver prices averaged $14.55 per ounce in the quarter, down 12.9% year over year. Platinum too fell 10.7% year over year to $822 per ounce, while palladium prices were up 16.5% year over year to $1,157 per ounce.
Financial Position
Franco-Nevada’s cash and cash equivalents fell to $69.7 million at the end of 2018, down substantially from the $511 million reported at the end of 2017. The company recorded operating cash flow of $474.8 million in 2018 compared with $488.6 million in 2017.
Franco-Nevada’s board of directors has announced a quarterly dividend of 24 cents per share. This dividend will be paid on Mar 28, to shareholders of record on Mar 14, 2019.
2018 Results
Franco-Nevada reported adjusted earnings per share of $1.17 in 2018, up 8.3% from prior year’s $1.08. The reported figure, however, missed the Zacks Consensus Estimate of $1.18.
Sales decreased 3.2% year over year to $653.2 million in 2018. Also, the top-line figure missed the Zacks Consensus Estimate of $663.6 million. In 2018, Franco-Nevada’s backlog was up 19%. The company sold 447,902 GEOs in 2018, down 10% year over year.
2019 Guidance
Franco-Nevada expects attributable royalty and stream production to total 465,000-500,000 GEOs from its mining assets. The company anticipates revenues between $70 million and $85 million from its energy assets, down from the previous guidance of $85-$88 million. It forecasts WTI oil price to average $55 per barrel. It estimates depletion expense of $295-$325 million.
Five-Year Outlook
Subsequent to the end of the third quarter, Franco-Nevada had made the final installment of the $1-billion funding commitment for the Cobre Panama project. The company expects this project to reach its initial-mill throughput capacity of 85 million tonnes per year, before 2023. Franco-Nevada expects to produce nearly 570,000-610,000 GEOs by 2023. Energy revenues, at WTI oil price of $55 per barrel, are estimated between $140 million and $160 million.
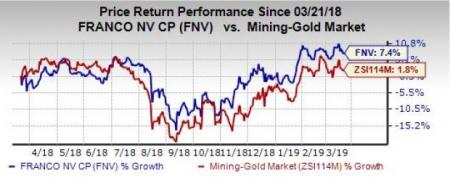
Shares of Franco-Nevada have gained 7.4%, over the past year, outperforming the industry’s growth of 1.8%.
Zacks Rank & Stocks to Consider
Franco-Nevada currently carries a Zacks Rank #3 (Hold).
A few better-ranked stocks in the Basic Materials sector are Ingevity Corporation (NYSE:NGVT) , Innospec Inc. (NASDAQ:IOSP) and Materion Corporation (NYSE:MTRN) , each sporting a Zacks Rank #1 (Strong Buy), currently. You can see the complete list of today’s Zacks #1 Rank stocks here.
Ingevity has an expected earnings growth rate of 17.9% for 2019. The company’s shares have rallied 34.1%, over the past year.
Innospec has a projected earnings growth rate of 3.5% for the current year. The stock has appreciated 14.3% in a year’s time.
Materion has an estimated earnings growth rate of 12.6% for 2019. The company’s shares have gained 5.6%, in the past year.
This Could Be the Fastest Way to Grow Wealth in 2019
Research indicates one sector is poised to deliver a crop of the best-performing stocks you'll find anywhere in the market. Breaking news in this space frequently creates quick double- and triple-digit profit opportunities.
These companies are changing the world – and owning their stocks could transform your portfolio in 2019 and beyond. Recent trades from this sector have generated +98%, +119% and +164% gains in as little as 1 month.
Click here to see these breakthrough stocks now >>
Innospec Inc. (IOSP): Free Stock Analysis Report
Ingevity Corporation (NGVT): Free Stock Analysis Report
Franco-Nevada Corporation (FNV): Free Stock Analysis Report
Materion Corporation (MTRN): Free Stock Analysis Report
Original post