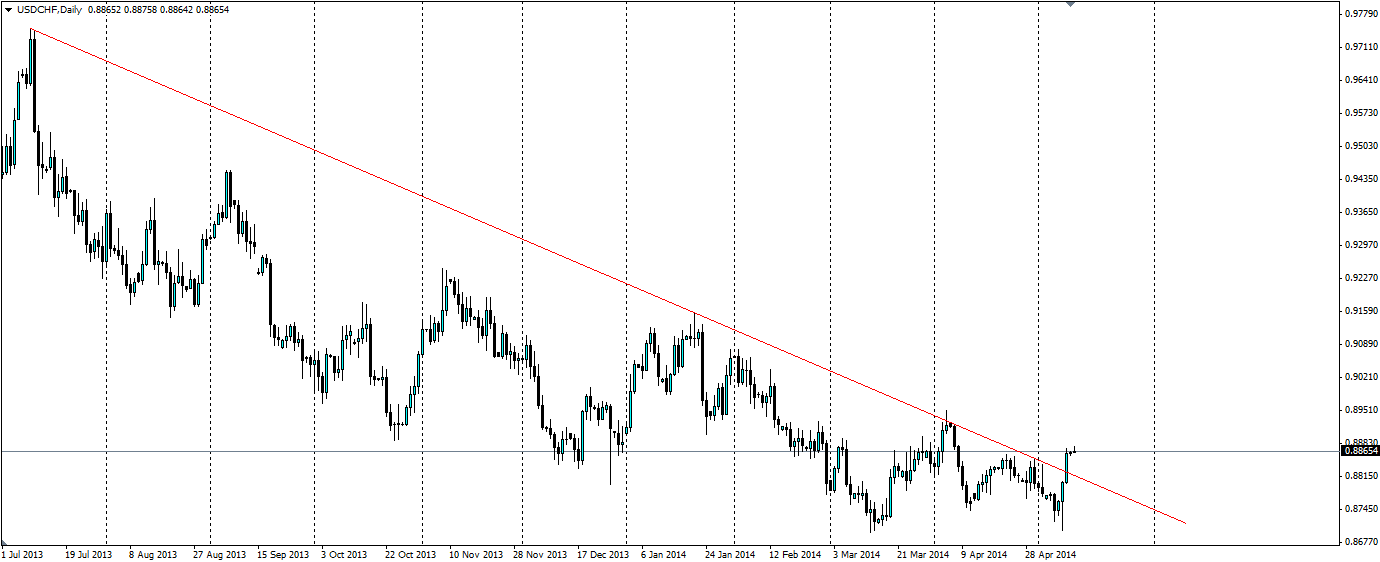
The Swiss Franc, one of the world’s safe haven assets, looks to have broken its downward trend against the US Dollar as the Greenback gains. A double pattern has formed, signalling a potential bullish trend could be forming.
The recent comments by Draghi sent investors fleeing the European region and back into the US Dollar, unfortunately for the Swissy, it got caught up in the action. This isn’t really too much of a surprise given the Euro region completely surrounds the Swiss region and accounts for 59% of Swiss exports and 75% of Imports.
Looking at the daily chart for the USD/CHF, we can see the price has pushed above the down trend that has been in play since July 2013. If this breakout holds, we could see the beginnings of a bullish trend for the pair.

Source: Blackwell Trader
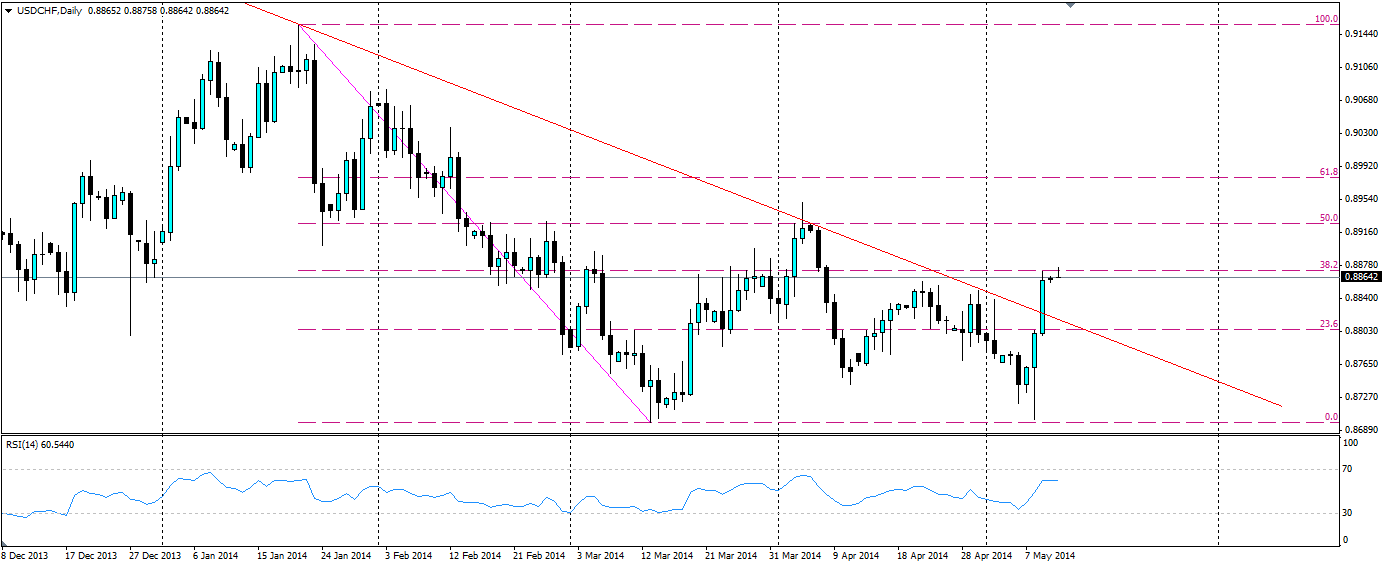
The CHF likes to play off technical support and resistance levels, so let’s take a look at some Fibonacci lines. Drawing a top from the peak in mid-January to mid-March, we can see the price retraced to the 50.0% Fibonacci line which also coincided with a testing of the trend line. As we can see, there was a false breakout of both.
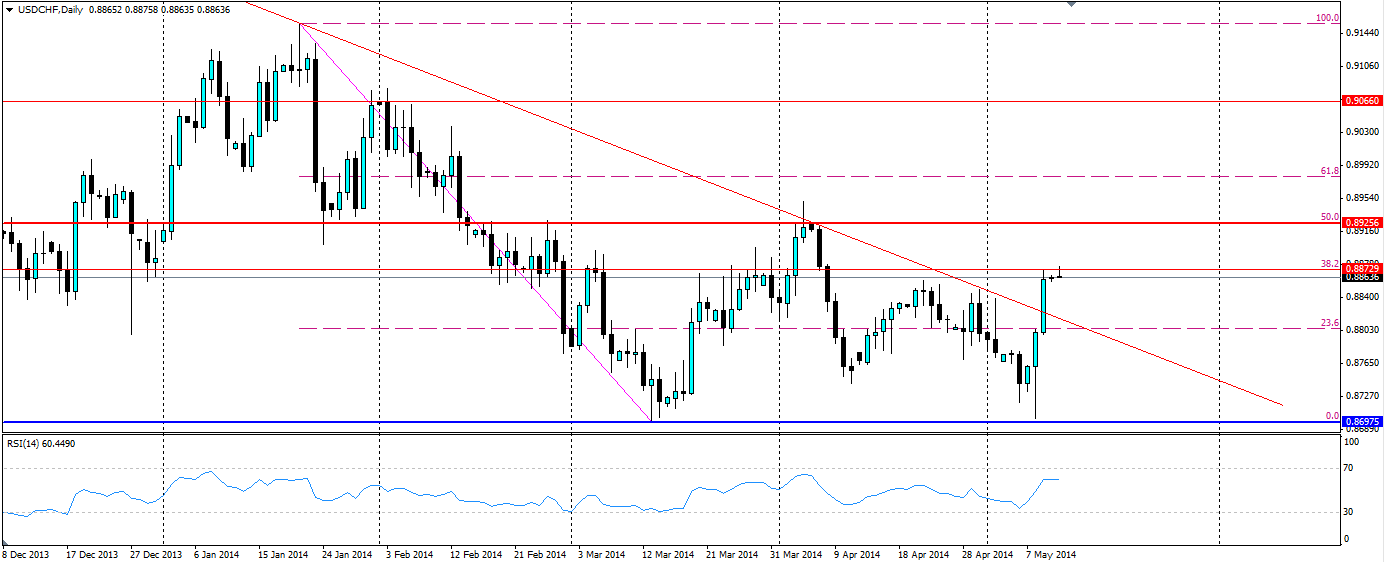
The next movement down off the 50.0% Fibonacci and the trend line saw support tested at the previous low which held to give us a nice double bottom, which happens to be a bullish reversal signal. The bounce off the support at 0.8702 led to a very solid looking bullish breakout candle which is currently testing the resistance at the 38.2% Fibonacci line.

Source: Blackwell Trader
The next major test for the price will be at the 50.0% Fibonacci level, which is the shoulder level for the double bottom pattern. If this breaks, we should see some solid price movement up. The RSI is certainly looking more bullish on the USD and could signal this reversal is beginning.
Support is found at 0.8697, 0.8632 and 0.8559 with resistance at the 38.2% Fibonacci line of 0.8873, the 50.0% Fibonacci line at 0.8926, and 0.9006 with the 50.0% line being the major test.

