
Fossil Group Inc. (NASDAQ:FOSL) released fourth-quarter 2018 results, wherein both top and bottom lines missed the Zacks Consensus Estimate. The top line continued to decline year over year. Moreover, management provided an unimpressive sales outlook for 2019, as it expects currency headwinds and business exits to impede results. Shares of this renowned watch retailer lost almost 16% during yesterday’s after-market trading session.
In fact, Fossil’s stock has tumbled 17.6% in the past three months compared with the industry’s decline of close to 12%. Nonetheless, this Zacks Rank #3 (Hold) company is committed toward transforming its business model to keep pace with consumers’ changing preferences. This is likely to aid a turnaround in its stock..jpg)
Q4 in Detail
Fossil’s adjusted earnings came in at $1.01 per share, significantly lower than the Zacks Consensus Estimate of $1.27. This marked Fossil’s first earnings miss in a long time. However, the bottom line fared much better than the year-ago quarter’s adjusted earnings of 64 cents. Fossil’s year-over-year bottom-line growth was hurt by currency movements to the tune of 9 cents. Otherwise, bottom-line growth was fueled by improved margins and lower interest expenses.
Fossil Group, Inc. Price, Consensus and EPS Surprise
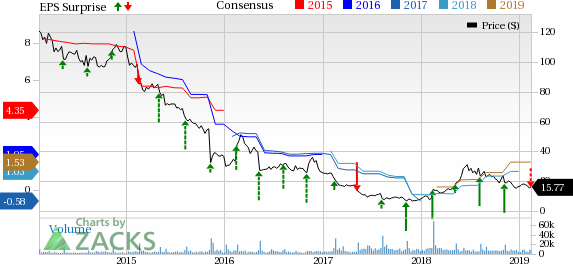
Fossil Group, Inc. Price, Consensus and EPS Surprise | Fossil Group, Inc. Quote
Worldwide net sales of $787 million declined nearly 15% year over year and also fell short of the Zacks Consensus Estimate of $810 million. Currency negatively impacted net sales by $15.6 million. On a constant-currency (cc) basis, worldwide net sales tumbled 13%. Results were largely impacted by lower promotional discounts and unfavorable pricing in the United States, persistent softness in Europe owing to political and economic hurdles, and delayed deliveries of new generation display watch supplies.
Markedly, the company witnessed lower watch sales in the Americas and Europe, partly offset by a slight rise in Asia sales at cc. Category wise, sales declined across watches, leather and jewelry businesses. At cc, connected watch sales grew moderately in Asia, while it declined across the Americas and Europe. Traditional watch sales were dismal in the Americas and Europe, though it remained flat in Asia.
Fossil progressed quite well in the digital space, as global direct e-commerce sales increased double digits yet again in the Americas and Asia, though it went down moderately in Europe.
Global retail comps declined 7%, owing to softness across all categories and geographies..
Moving on, gross margin expanded 430 basis points (bps) to 53.0%, courtesy of reduced promotions, enhanced off-price margins, favorable year-over-year comparison related to an inventory valuation reserve, and margin enhancement efforts stemming from the company’s New World Fossil (“NWF”) plan.
The company posted an operating income of $67.3 million, up 31.2% year over year. The upside was backed by lower operating expenses. This was somewhat negated by lower sales.
Performance Based on Business Categories
Category wise, sales in the watches segment declined 13% to $636 million in the quarter. Sales in the jewelry and leather businesses also fell 29% to $51 million and 20% to $86 million, respectively.
Region-Wise Performance
Region wise, sales dropped 15% in the Americas to $377 million, mainly owing to weak sales in the United States.
Sales declined 19% in Europe to $272 million. The downside was mainly caused by weak Eurozone sales, and softness in Eastern Europe and the Middle East distributor markets. France, Germany and the U.K. witnessed maximum downsides.
Net sales from Asia slipped 5% to $135 million as improvements in China, India and Hong Kong were countered by weakness in most of the other regions, with maximum declines recorded in Australia, Japan and Taiwan.
Other Updates
At the end of the quarter, the company had cash and cash equivalents of $403.4 million, long-term debt of $269.8 million and shareholders’ equity of $588.6 million. Additionally, the company expects to incur capital expenditures of nearly $30 million in 2019.
Fossil operated 484 stores as of Dec 29, 2018, including 236 full-priced accessory stores, 8 full-priced multi-brand stores and 240 outlet stores. Out of all Fossil stores, 215 are located in the Americas, while 173 and 96 are located in Europe and Asia, respectively.
Outlook
Management remains impressed with its 2018 performance, wherein the company achieved its important targets of improving overall profits and solidifying its financial position. Notably, Fossil concluded 2018 as a smaller but more profitable entity, with considerably higher operating income and lower debt level.
For 2019, management is committed toward leveraging opportunities in the connected watch space, stabilizing sales of its traditional watches and enhancing overall efficiency. All said, Fossil is focused on expanding market share in the growing global watch space.
2019 Forecasts
Fossil expects net sales to decline 7-12% in 2019. This includes negative impacts stemming from business exits and currency movements of 2.5% and 1.5%, respectively.
The company expects gross margin to be 51.5-53.5%. Operating margin is anticipated to be 0.5-3.0%. Interest expenses are expected to be roughly $35 million.
Q1 Forecasts
For first-quarter 2019, the company expects net sales to decline 16-22%, considering the negative impacts of approximately 3.5% from business exits and 4% due to unfavorable currency movements. Gross margin is predicted to be 51.0-53.0%. Interest expenses are expected to be roughly $9 million.
3 Retail Stocks to Bet on
Boot Barn Holdings (NYSE:BOOT) , with long-term earnings per share growth rate of 20.7%, carries a Zacks Rank #1 (Strong Buy). You can see the complete list of today’s Zacks #1 Rank stocks here.
DSW Inc. (NYSE:DSW) , with long-term earnings per share growth rate of 9%, carries a Zacks Rank #1.
Zumiez (NASDAQ:ZUMZ) , with a Zacks Rank #1, has long-term earnings per share growth rate of 12.5%.
Will You Make a Fortune on the Shift to Electric Cars?
Here's another stock idea to consider. Much like petroleum 150 years ago, lithium power may soon shake the world, creating millionaires and reshaping geo-politics. Soon electric vehicles (EVs) may be cheaper than gas guzzlers. Some are already reaching 265 miles on a single charge.
With battery prices plummeting and charging stations set to multiply, one company stands out as the #1 stock to buy according to Zacks research.
It's not the one you think.
See This Ticker Free >>
Fossil Group, Inc. (FOSL): Free Stock Analysis Report
Zumiez Inc. (ZUMZ): Free Stock Analysis Report
DSW Inc. (DSW): Free Stock Analysis Report
Boot Barn Holdings, Inc. (BOOT): Free Stock Analysis Report
Original post
Zacks Investment Research