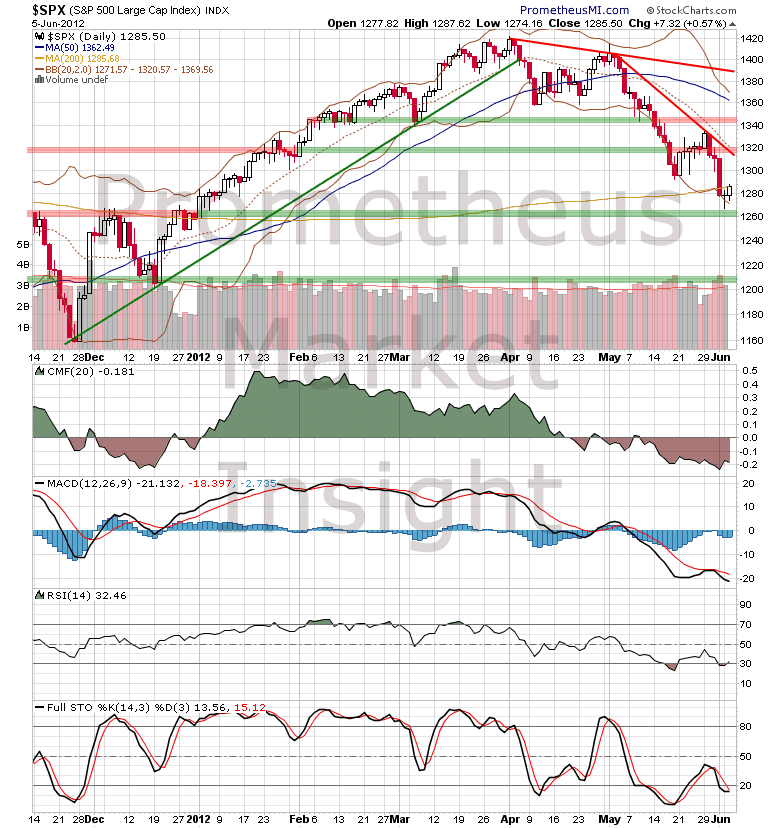
The S&P 500 index closed moderately higher yesterday, reacting off of recent short-term lows of the violent downtrend from April and returning to long-term support at the 200-day moving average.
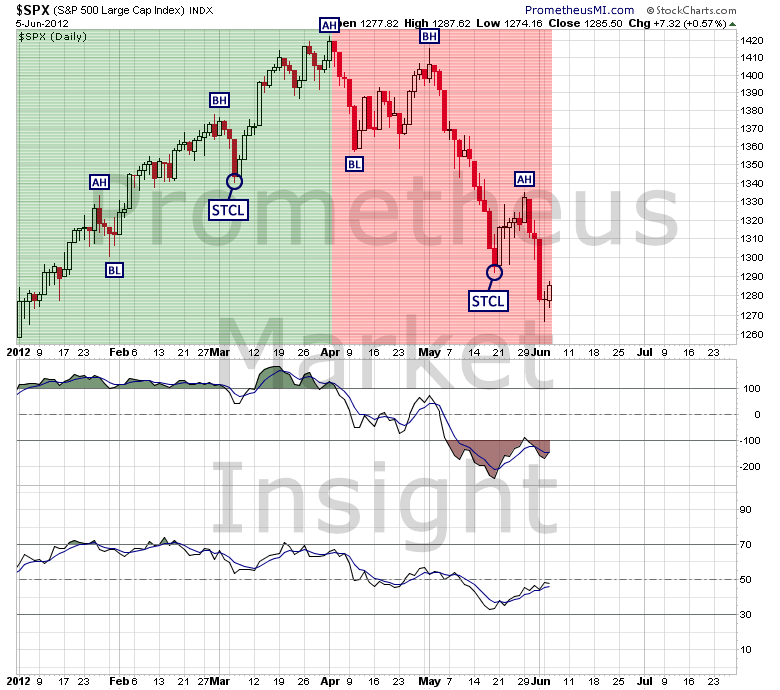
With respect to cycle analysis, the early formation of the alpha high (AH) after only six sessions was a bearish development that favors the continuation of left translation. Therefore, the formation of a sustainable low at this time is unlikely, and any traders who are taking market positions based upon that assumption are aligning themselves with a low probability scenario, a strategy the invariably leads to poor performance over the long run.
The next short-term low will likely not develop until the upcoming beta low (BL), and cycle analysis provides a very clear window during which that low is expected to occur.
The primary failing of most market participants is that they tend to suffer from an extreme form of myopia. Most investors focus on the daily price movements of the major market indices. When stocks are up substantially, they feel bullish. When stocks fall precipitously, they become bearish.
The problem, of course, is that market behavior only has meaning when viewed in context. Short-term trends and cycles are subcomponents of intermediate-term trends and cycles, which are in turn subcomponents of long-term trends and cycles. In order to understand what today’s market behavior means, it must be analyzed in terms of what has transpired previously across all relevant time frames.
That is why judiciously applied chart analysis is so successful at identifying the most likely scenarios and their associated probabilities; not only does it evaluate the highest quality fundamental and sentiment data available at the moment, it also provides the context required to correctly interpret price behavior. Granted, the market may not always be “right,” but it never loses an argument, which is why our focus is on interpreting market behavior and then aligning ourselves with it.
- English (UK)
- English (India)
- English (Canada)
- English (Australia)
- English (South Africa)
- English (Philippines)
- English (Nigeria)
- Deutsch
- Español (España)
- Español (México)
- Français
- Italiano
- Nederlands
- Português (Portugal)
- Polski
- Português (Brasil)
- Русский
- Türkçe
- العربية
- Ελληνικά
- Svenska
- Suomi
- עברית
- 日本語
- 한국어
- 简体中文
- 繁體中文
- Bahasa Indonesia
- Bahasa Melayu
- ไทย
- Tiếng Việt
- हिंदी
Formation of Meaningful Low In Stocks Remains Unlikely
Published 06/06/2012, 03:50 AM
Formation of Meaningful Low In Stocks Remains Unlikely
Latest comments
Loading next article…
Install Our App
Risk Disclosure: Trading in financial instruments and/or cryptocurrencies involves high risks including the risk of losing some, or all, of your investment amount, and may not be suitable for all investors. Prices of cryptocurrencies are extremely volatile and may be affected by external factors such as financial, regulatory or political events. Trading on margin increases the financial risks.
Before deciding to trade in financial instrument or cryptocurrencies you should be fully informed of the risks and costs associated with trading the financial markets, carefully consider your investment objectives, level of experience, and risk appetite, and seek professional advice where needed.
Fusion Media would like to remind you that the data contained in this website is not necessarily real-time nor accurate. The data and prices on the website are not necessarily provided by any market or exchange, but may be provided by market makers, and so prices may not be accurate and may differ from the actual price at any given market, meaning prices are indicative and not appropriate for trading purposes. Fusion Media and any provider of the data contained in this website will not accept liability for any loss or damage as a result of your trading, or your reliance on the information contained within this website.
It is prohibited to use, store, reproduce, display, modify, transmit or distribute the data contained in this website without the explicit prior written permission of Fusion Media and/or the data provider. All intellectual property rights are reserved by the providers and/or the exchange providing the data contained in this website.
Fusion Media may be compensated by the advertisers that appear on the website, based on your interaction with the advertisements or advertisers.
© 2007-2025 - Fusion Media Limited. All Rights Reserved.
