AUD/USD Timid But Holding
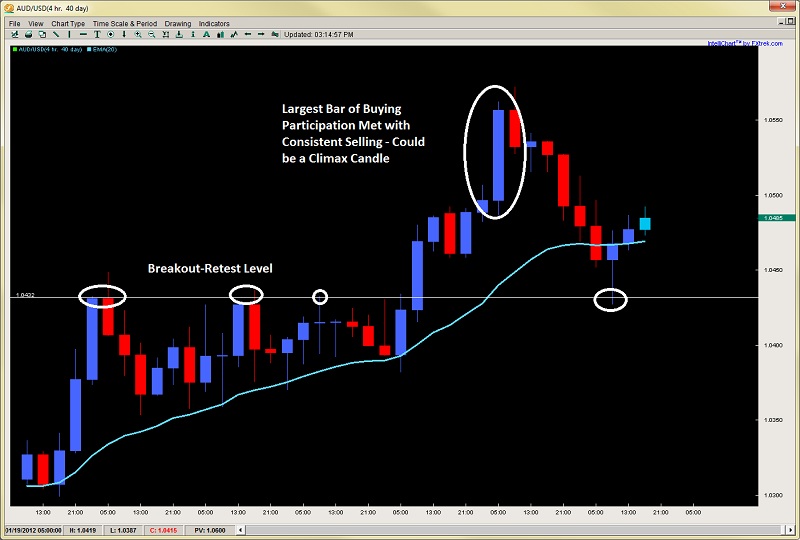
After failing 3x to break the key 1.0384 resistance level, the Aussie broke through to higher ground, albeit stutter step style. The first punch through actually resulted in a false break, but then played off the aforementioned level in a typical breakout-retest style. We gave price action triggers to watch out for which played out perfectly so hopefully you made some money on that.
What we are noticing is how the pair broke through the big figure at 1.0500. Look to the large candle at the top of the move. This is the largest 4hr candle from an open to close basis (bull candle that is) for the entire year and came on the heels of clearing out 1.0500.

But how did the market respond since then? It sold off over 140pips before finding any buyers. This could represent a buying climax which could suggest a lower high followed by another pullback.
Although buyers found support at the price action breakout-retest level of 1.0432, we think bulls should be weary as the market is unlikely to attract a significant amount of new bulls between here and yesterday’s highs at 1.0572. Bears may want to watch the 1hr or 4hr for price action clues as to a short term play to the downside. Bulls in the meantime can either wait for a timid pullback to the 1.0432 level, or possibly the 20ema before getting back in as the upside is looking a little strained at the moment.
Also keep in mind, over the last 12 day run, every red candle was followed by a bull candle, so a 2nd bear candle would suggest a little deeper pullback.
EUR/USD – Below the Kumo, Above the Kijun
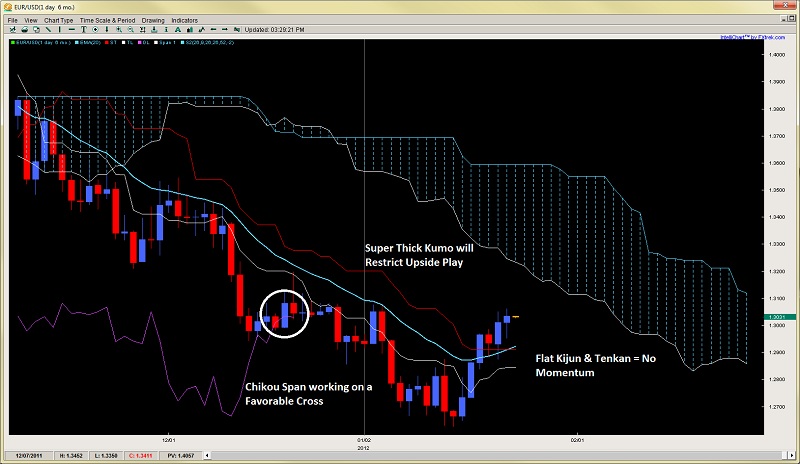
After forming a nice TKx Sell Signal back at 1.3500 that went over 800+pips south, the Euro has remained below the 20ema and the Kijun the entire time communicating the consistency of the downtrend since it broke below the Kumo. What is interesting to note is how price has just broken the Kijun for the first time since November of last year. It should be noted it has done this on the heels of an impressive 5 out of 6 day climb. Although the candles are getting smaller suggesting the rally may be running out of steam, the Chikou Span is close to forming a ‘favorable cross‘ of the price action. It would still need to clear the Tenkan and Kijun to complete this, but its making progress.

But the bottom line is, from an ichimoku perspective, the pair still has a giant Kumo to clear while the Tenkan and Kijun are totally flat, suggesting moment is sideways at the moment. This could either be because of a) they (tenkan and kijun) are trying to catch up to the price action bounce or b) they are reading a waning momentum in the pair.
Either way, the EUR/USD has its work cut out before we can say we have reversed the last downtrend. All these clues point to a likely rally which is fading, thus offering another attempt to get short before another leg down to the sub 1.2700 region and yearly lows. Watch for this rally to possibly fade towards the end of this week. Key levels to watch would be the lower edge of the Kumo near the 1.3200 level while ambitious bulls can take plays off the 1.2900 level for now.
After failing 3x to break the key 1.0384 resistance level, the Aussie broke through to higher ground, albeit stutter step style. The first punch through actually resulted in a false break, but then played off the aforementioned level in a typical breakout-retest style. We gave price action triggers to watch out for which played out perfectly so hopefully you made some money on that.
What we are noticing is how the pair broke through the big figure at 1.0500. Look to the large candle at the top of the move. This is the largest 4hr candle from an open to close basis (bull candle that is) for the entire year and came on the heels of clearing out 1.0500.

But how did the market respond since then? It sold off over 140pips before finding any buyers. This could represent a buying climax which could suggest a lower high followed by another pullback.
Although buyers found support at the price action breakout-retest level of 1.0432, we think bulls should be weary as the market is unlikely to attract a significant amount of new bulls between here and yesterday’s highs at 1.0572. Bears may want to watch the 1hr or 4hr for price action clues as to a short term play to the downside. Bulls in the meantime can either wait for a timid pullback to the 1.0432 level, or possibly the 20ema before getting back in as the upside is looking a little strained at the moment.
Also keep in mind, over the last 12 day run, every red candle was followed by a bull candle, so a 2nd bear candle would suggest a little deeper pullback.
EUR/USD – Below the Kumo, Above the Kijun
After forming a nice TKx Sell Signal back at 1.3500 that went over 800+pips south, the Euro has remained below the 20ema and the Kijun the entire time communicating the consistency of the downtrend since it broke below the Kumo. What is interesting to note is how price has just broken the Kijun for the first time since November of last year. It should be noted it has done this on the heels of an impressive 5 out of 6 day climb. Although the candles are getting smaller suggesting the rally may be running out of steam, the Chikou Span is close to forming a ‘favorable cross‘ of the price action. It would still need to clear the Tenkan and Kijun to complete this, but its making progress.

But the bottom line is, from an ichimoku perspective, the pair still has a giant Kumo to clear while the Tenkan and Kijun are totally flat, suggesting moment is sideways at the moment. This could either be because of a) they (tenkan and kijun) are trying to catch up to the price action bounce or b) they are reading a waning momentum in the pair.
Either way, the EUR/USD has its work cut out before we can say we have reversed the last downtrend. All these clues point to a likely rally which is fading, thus offering another attempt to get short before another leg down to the sub 1.2700 region and yearly lows. Watch for this rally to possibly fade towards the end of this week. Key levels to watch would be the lower edge of the Kumo near the 1.3200 level while ambitious bulls can take plays off the 1.2900 level for now.
