GBP/USD – Dynamic Support Doesn’t Disappoint
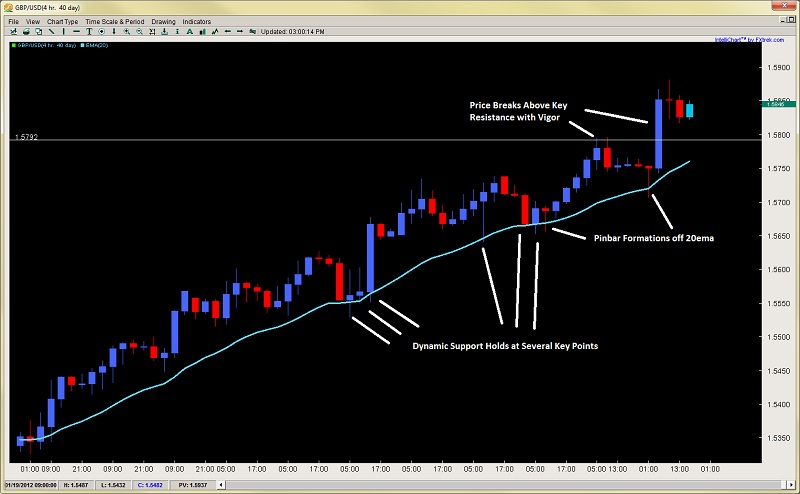
As we wrote about yesterday, discussing how the dynamic support for the cable was holding on the 4hr 20ema, this played out to perfection as price touched the 20ema, formed a pinbar, then launched up over 100pips in the next 4hrs to break the key resistance just sub 1.5800.
In fact, we wrote that price will likely pullback just shy of the 1.5700 level. Well, price touched a low of 1.5706 and then proceeded to climb over 150+pips to close the day at 1.5831. Many of our price action traders got into this trade ahead of time so hopefully you got to take advantage of this.
 GBP/USD" title="GBP/USD" width="441" height="330" />
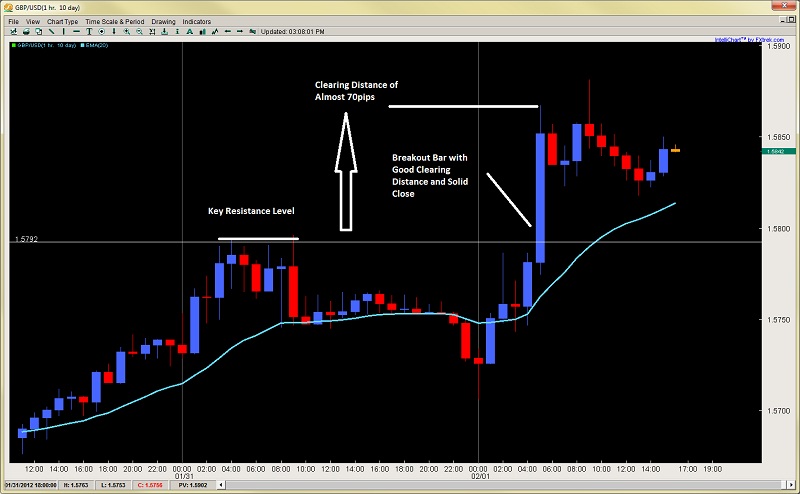
Since then, looking at the 1hr chart below, price has been relatively stable with a decent rejection above 1.5850. If you take a look at the breakout bar, you will notice it has some key characteristics of a healthy breakout, such as;
1) large body suggesting strong buying during the candle and likely stops taken out on the sustained break
2) close not too far off the highs suggesting little profit taking
3) good clearing distance from the prior resistance level

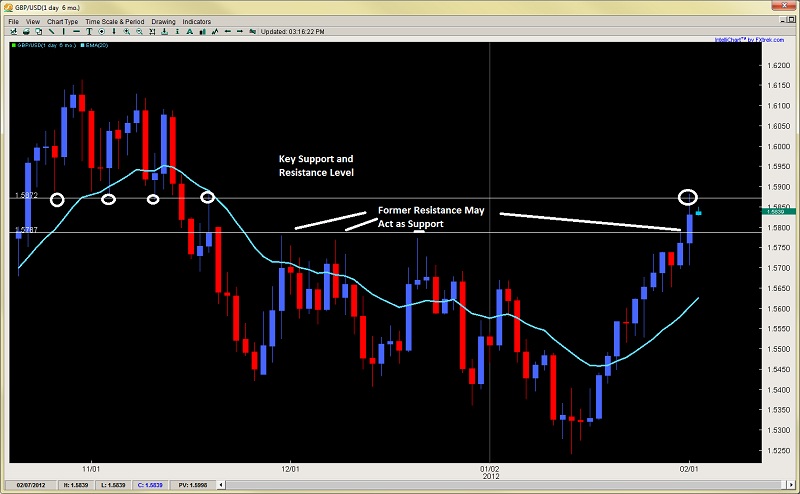
All of these suggest a healthy breakout so we would be open to the price action breakout-pullback setup looking for longs at this level. Considering how price has been ‘floating’ above this level, it is possible it may not reach our pullback level so aggressive and impatient day traders who believe price has put in a short term base, can either take a long at 1.5857 with tight stops below, as this is a key support level which you can also see in the daily chart below.

In addition to this short term play, aggressive day traders can have another order waiting at 1.5800. We suspect though the 1.5800 figure will hold short term and offer a move back to 1.5850/67 where it will test the sellers parked there holding the upside for now. Should yesterday’s highs get cleared, expect a decent fight till price passes 1.5910. After this, we expect the big figure at 1.6000 to be touched if the price action remains impulsive and consistent.
As we wrote about yesterday, discussing how the dynamic support for the cable was holding on the 4hr 20ema, this played out to perfection as price touched the 20ema, formed a pinbar, then launched up over 100pips in the next 4hrs to break the key resistance just sub 1.5800.
In fact, we wrote that price will likely pullback just shy of the 1.5700 level. Well, price touched a low of 1.5706 and then proceeded to climb over 150+pips to close the day at 1.5831. Many of our price action traders got into this trade ahead of time so hopefully you got to take advantage of this.
 GBP/USD" title="GBP/USD" width="441" height="330" />
Since then, looking at the 1hr chart below, price has been relatively stable with a decent rejection above 1.5850. If you take a look at the breakout bar, you will notice it has some key characteristics of a healthy breakout, such as;
1) large body suggesting strong buying during the candle and likely stops taken out on the sustained break
2) close not too far off the highs suggesting little profit taking
3) good clearing distance from the prior resistance level

All of these suggest a healthy breakout so we would be open to the price action breakout-pullback setup looking for longs at this level. Considering how price has been ‘floating’ above this level, it is possible it may not reach our pullback level so aggressive and impatient day traders who believe price has put in a short term base, can either take a long at 1.5857 with tight stops below, as this is a key support level which you can also see in the daily chart below.

In addition to this short term play, aggressive day traders can have another order waiting at 1.5800. We suspect though the 1.5800 figure will hold short term and offer a move back to 1.5850/67 where it will test the sellers parked there holding the upside for now. Should yesterday’s highs get cleared, expect a decent fight till price passes 1.5910. After this, we expect the big figure at 1.6000 to be touched if the price action remains impulsive and consistent.
