GBP/USD – Dynamic Support Continues to Hold
Quietly under the radar while daily ranges continue to contract in the Cable, the GBP/USD has been mounting an impressive run, albeit at a tortuga pace. Part of the reason it has been deceptive is because intraday volatility levels have shrunk in half since the start of the year as the Sterling is now reaching its lowest ATR levels in over 3+ years.
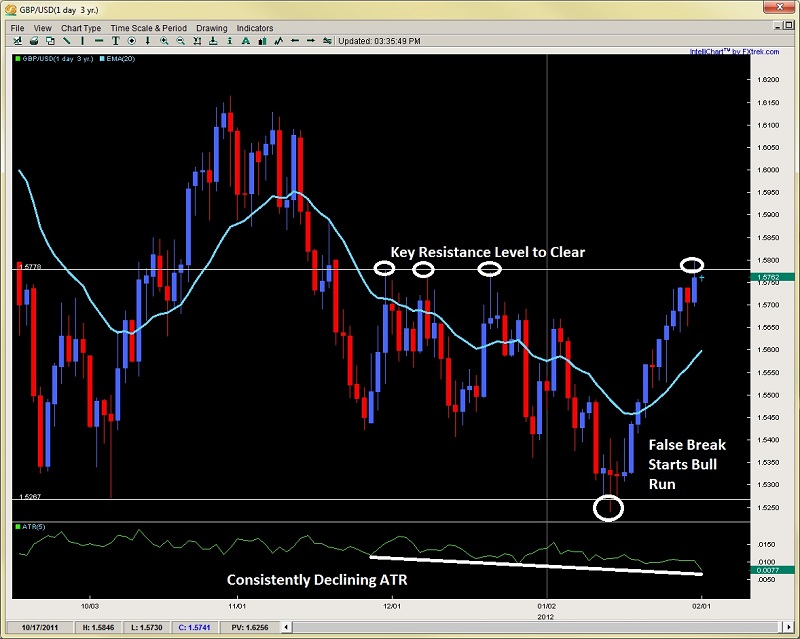
But regardless, the pair has posted an impressive 9 bull closes out of the last 11 days. This consistent buying while intraday ranges have shrunk suggest either timidity on the part of the bulls, or a quiet accumulation as the ATR (5 periods) has actually been falling when the bull run started. It’s three strongest candles (on an open to close basis) were in the beginning of this run so with the shrinking candles as price has approached the key 1.5778 resistance level, it suggests the bulls in this move have been taking profits, but not closing shop yet.
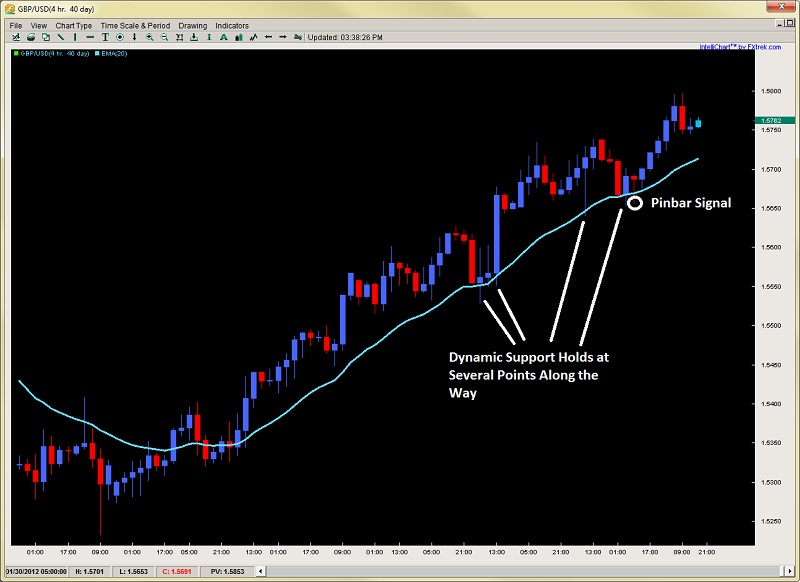
 Today’s false break is not a fierce rejection off the key level which could mean the bulls are going to take another stab at the highs. Looking at the 4hr chart below, we can see how the 20ema has acted as dynamic support all along the way offering several good with-trend entries for traders, including a recent pinbar signal.
 If the bull run is to continue, we suspect a likely intraday pullback to the 1.5700 level (perhaps a few pips above) from both a price action and the 20em acting consistently as dynamic support. Watch for price action triggers off these aforementioned levels for possible longs targeting sub 1.5800 levels. If a 4hr candle closes above the figure, we suspect a slow march up to 1.5850/70 before running into any new sellers.
Bears will want to see either another rejection off of 1.5800 (which they can play with tight stops), a false break with rejection above but close back in the range, or impulsive selling below 1.5800, producing a LH (lower high) followed by a close below the 20ema.
EUR/USD – Two-Bar Trading Range Plays Out As Planned
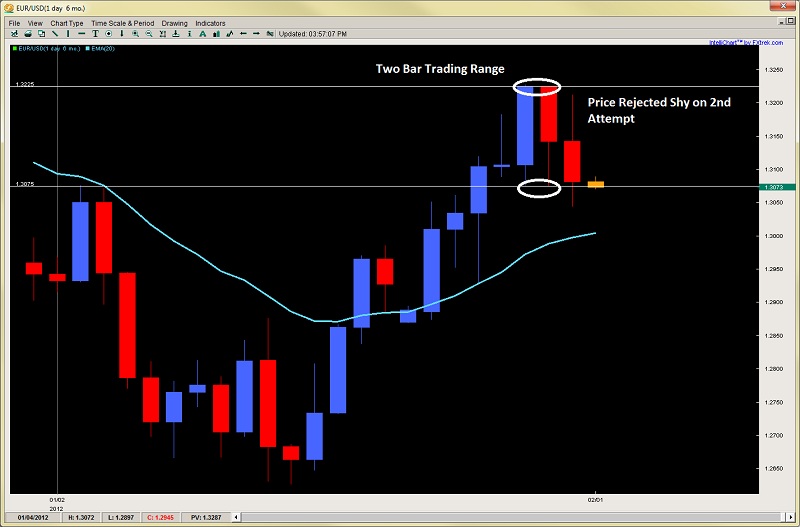
As we talked about yesterday in our daily post, we suggested the most likely path for the EUR/USD was to re-challenge the previous days high but making a failure just shy of it with a good sell around 1.3200. This played out to perfection as the pair barely eclipsed the 1.3200 highs by 11pips, then sold off to our 1.3084 target. Many of our price action traders did well on this catching the short side for over +115pips using a less than 40pip stop for an almost 3:1 R:R play.

Based on the fact price rejected just shy of yesterday’s high, while producing a LL (lower low) suggests to us it will likely form another LH (lower High) in the process before making another push to the downside. Some bears may be trapped on the false break below 1.3075 which may cause another rally, but it seems unlikely to take out the 1.3230 (day before) and yesterday’s high at 1.3211.

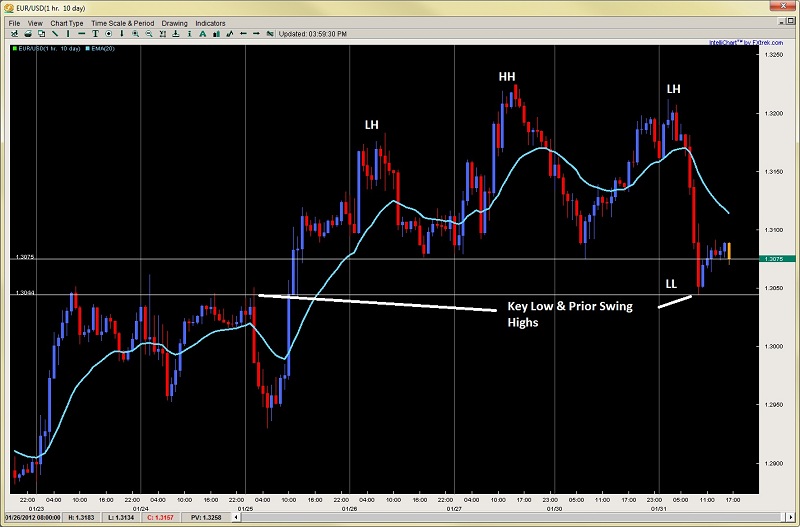
Taking a look at the intraday charts, we can see the structure has broken down a bit with the last move being a LH (lower high). We would be impressed if price tomorrow takes out yesterdays highs. In fact, we suspect any rallies into the upper levels of yesterdays price action will be sold aggressively (unless today’s aggressive selling was a one-off which we do not take credence in). Thus, traders can thus look for price action clues up at these loftier levels but we suspect a pullback to 1.3000 is on the cards in the next few days. Any major break and hold below 1.3045 will likely inspire fresh intraday shorts to challenge 1.3000 in a jiffy.
Quietly under the radar while daily ranges continue to contract in the Cable, the GBP/USD has been mounting an impressive run, albeit at a tortuga pace. Part of the reason it has been deceptive is because intraday volatility levels have shrunk in half since the start of the year as the Sterling is now reaching its lowest ATR levels in over 3+ years.
But regardless, the pair has posted an impressive 9 bull closes out of the last 11 days. This consistent buying while intraday ranges have shrunk suggest either timidity on the part of the bulls, or a quiet accumulation as the ATR (5 periods) has actually been falling when the bull run started. It’s three strongest candles (on an open to close basis) were in the beginning of this run so with the shrinking candles as price has approached the key 1.5778 resistance level, it suggests the bulls in this move have been taking profits, but not closing shop yet.
 Today’s false break is not a fierce rejection off the key level which could mean the bulls are going to take another stab at the highs. Looking at the 4hr chart below, we can see how the 20ema has acted as dynamic support all along the way offering several good with-trend entries for traders, including a recent pinbar signal.
 If the bull run is to continue, we suspect a likely intraday pullback to the 1.5700 level (perhaps a few pips above) from both a price action and the 20em acting consistently as dynamic support. Watch for price action triggers off these aforementioned levels for possible longs targeting sub 1.5800 levels. If a 4hr candle closes above the figure, we suspect a slow march up to 1.5850/70 before running into any new sellers.
Bears will want to see either another rejection off of 1.5800 (which they can play with tight stops), a false break with rejection above but close back in the range, or impulsive selling below 1.5800, producing a LH (lower high) followed by a close below the 20ema.
EUR/USD – Two-Bar Trading Range Plays Out As Planned
As we talked about yesterday in our daily post, we suggested the most likely path for the EUR/USD was to re-challenge the previous days high but making a failure just shy of it with a good sell around 1.3200. This played out to perfection as the pair barely eclipsed the 1.3200 highs by 11pips, then sold off to our 1.3084 target. Many of our price action traders did well on this catching the short side for over +115pips using a less than 40pip stop for an almost 3:1 R:R play.

Based on the fact price rejected just shy of yesterday’s high, while producing a LL (lower low) suggests to us it will likely form another LH (lower High) in the process before making another push to the downside. Some bears may be trapped on the false break below 1.3075 which may cause another rally, but it seems unlikely to take out the 1.3230 (day before) and yesterday’s high at 1.3211.

Taking a look at the intraday charts, we can see the structure has broken down a bit with the last move being a LH (lower high). We would be impressed if price tomorrow takes out yesterdays highs. In fact, we suspect any rallies into the upper levels of yesterdays price action will be sold aggressively (unless today’s aggressive selling was a one-off which we do not take credence in). Thus, traders can thus look for price action clues up at these loftier levels but we suspect a pullback to 1.3000 is on the cards in the next few days. Any major break and hold below 1.3045 will likely inspire fresh intraday shorts to challenge 1.3000 in a jiffy.
