GBP/USD – Breaking Down
After making a valiant attempt to hold serve above the 1.5850 level since Oct. 21st and forming three lower highs, the GBP/USD has broken through a critical level which has held for the last 3 weeks. What is interesting to note is how it broke through this key support.
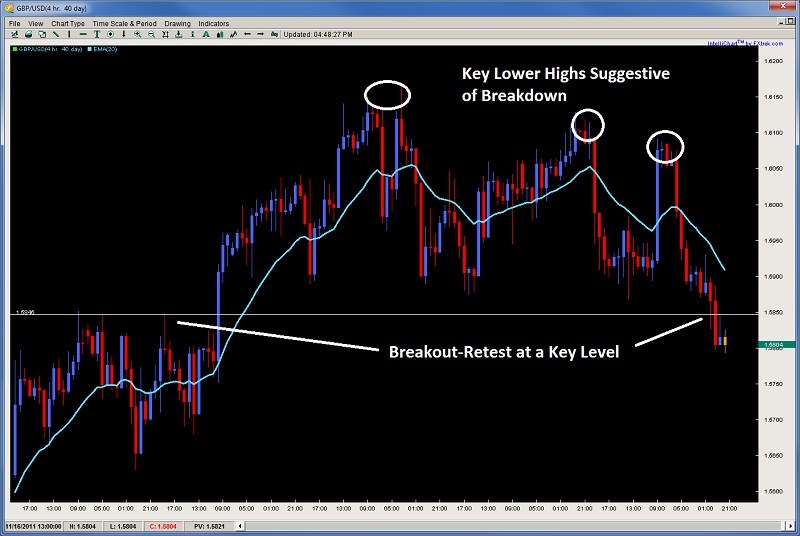
Take a look at the chart below on the 4hr time frame. Notice how price broke through with vigor which is communicative the Bears either took out the stops below the key level or pushed through with force. On the next candle price did a perfect breakout-retest setup which our price action traders got a great low risk/high reward entry on. This breakout-retest could act as resistance for any pullbacks offering bears a good opportunity to get back in. Should this level hold the upside, we expect prices to head for 1.5700 before running into any new buyers.

NZD/USD – Formed a TKx Signal on the Dailies
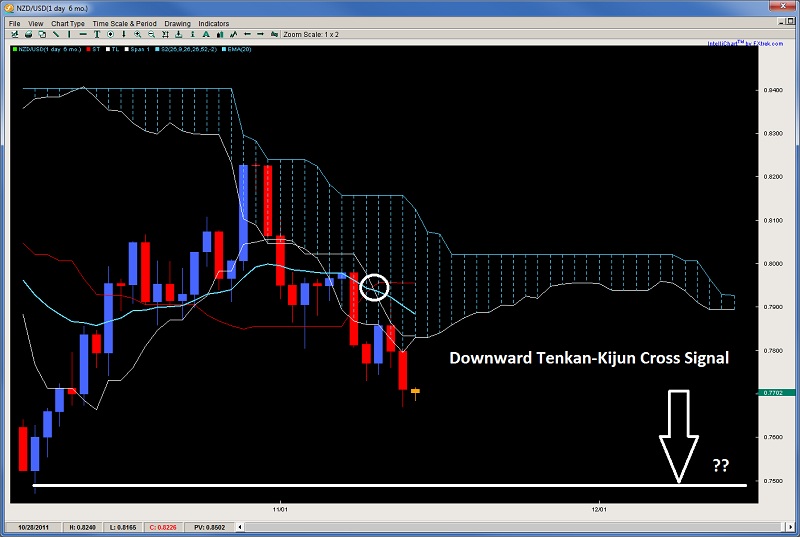
As we wrote about the bearish prospects of the NZD/USD yesterday and over 125pips ago, the Kiwi has now formed a downward Ichimoku TKx signal on the daily charts which does not portend well for bulls. The Tenkan-sen is diving fast suggesting momentum is quite strong behind this move. Currently, price action is holding just around the .7700 figure. If the lows can break the .7670 level, then .7600 and .7500 will be up next but this has the potential for a large fall.

After making a valiant attempt to hold serve above the 1.5850 level since Oct. 21st and forming three lower highs, the GBP/USD has broken through a critical level which has held for the last 3 weeks. What is interesting to note is how it broke through this key support.
Take a look at the chart below on the 4hr time frame. Notice how price broke through with vigor which is communicative the Bears either took out the stops below the key level or pushed through with force. On the next candle price did a perfect breakout-retest setup which our price action traders got a great low risk/high reward entry on. This breakout-retest could act as resistance for any pullbacks offering bears a good opportunity to get back in. Should this level hold the upside, we expect prices to head for 1.5700 before running into any new buyers.

NZD/USD – Formed a TKx Signal on the Dailies
As we wrote about the bearish prospects of the NZD/USD yesterday and over 125pips ago, the Kiwi has now formed a downward Ichimoku TKx signal on the daily charts which does not portend well for bulls. The Tenkan-sen is diving fast suggesting momentum is quite strong behind this move. Currently, price action is holding just around the .7700 figure. If the lows can break the .7670 level, then .7600 and .7500 will be up next but this has the potential for a large fall.

