Following a short reprieve, we can only conclude that the Greek soap opera is back on. The markets were in turmoil again last week, as uncertainties continued to plague the eurozone. Greece has still not succeeded in forming a government, and Greeks will return to the ballot box on June 17. The result from this second vote will essentially determine Greece’s future in the eurozone. Greek and Spanish banks have seen their clients remove about 2 and 5 billion Euros respectively in deposits since the beginning of the month and because of this, stock exchanges are on pins and needles as they wait for the outcome of this saga, leading investors to punish risky assets through massive selling, in order to buy more U.S. dollars.
Canada
The week will be shorter than usual in Canada, and very few economic indicators are expected. The only important ones will be the Leading Indicators Index and Retail Sales for March to be release on Wednesday. Economists are expecting retail sales to have grown 0.3% in March.
United States
The week will be just as short on news in the U.S. On Thursday we are expecting Durable Goods Orders for April, an important measure of economic activity. Analysts are expecting a figure of 0.5%, or 4.7% more than last time. On Friday, the Michigan Consumer Sentiment Index will provide us with a reading of the pulse of consumers.
International
Naturally, we will continue closely monitoring events as they unfold in the European saga, furthermore with the summit to be held this Wednesday. The finance ministers will necessarily discuss topics like how to keep Greece in the euro area and on how to stimulate growth while maintaining the austerity measures currently in place. In addition to this political news, China’s Purchasing Managers’ Index and Europe’s Consumer Confidence Index will be released on Tuesday. On Wednesday, the Bank of Japan will announce its key interest rate decision and on Thursday, we will have the latest figures on Germany’s GDP. Because Germany represents 25% of the eurozone economy, this is a very important figure. Germany’s Manufacturing Purchasing Managers’ Index will also be released on Thursday, followed by Germany’s Ifo Business Climate Survey on the state of the economy. We wish you a great week.
The Loonie
It's easier to go down a hill than up it but the view is much better at the top. - Henry Ward Beecher
While eyes are on Europe and Greece, the fall of oil prices since two weeks added to downward pressure on the Canadian dollar. Because of our exports of petroleum products, the Canadian dollar is positively correlated to changes in oil prices. It is therefore important to consider the factors influencing oil prices to predict the evolution of the Canadian dollar. In addition to questions about the economic strength in a European context of financial uncertainty, the pressure drop associated with the Iranian situation has fostered a sharp drop in oil prices. The price of a barrel of oil (Brent) rose from $ 20 between December 2011 and March this year. Since then, the structural increase in supply, the sluggishness of European and American economies and the hope of a settlement of the Iranian crisis have tended to make him retreat.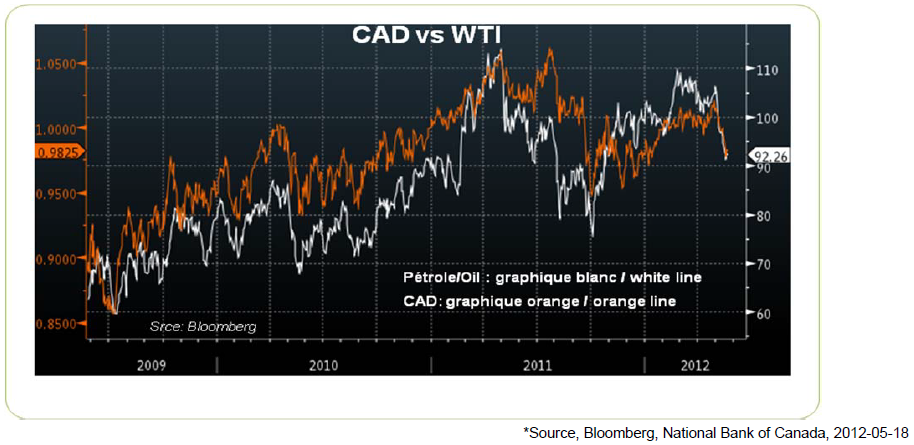
On the 19th of March, Christine Lagarde, Executive Director of the IMF warned that "a rise in oil prices could derail the recovery." As highlighted recently by our geopolitical analyst Pierre Fournier; the United States, Europe and China have every reason to deal with Iran. While the U.S. economy begins to falter, soaring oil prices and gasoline could be fatal for re-election chances of Barack Obama. Democratic strategists have not forgotten the impact that had occurred in 1980 and contributed to the defeat of President Carter against Ronald Reagan. In a context where the Iranians perceive favorably re-election of U.S. President, the risk of military confrontation involving Iran has undoubtedly eased in recent weeks. Although it would be premature (and naive) to assume that the Iranian problem will disappear, the meeting held on the 23rd of May in Baghdad between Iran and the five permanent members of UN Security (plus Germany) could allow a happy ending. Such a development would add to the recent strength of the U.S. dollar at the expense of the loonie. Stay tuned!
Technical Analysis: EURUSD (Tuesday, May 22, 2012, EURUSD in daily data)
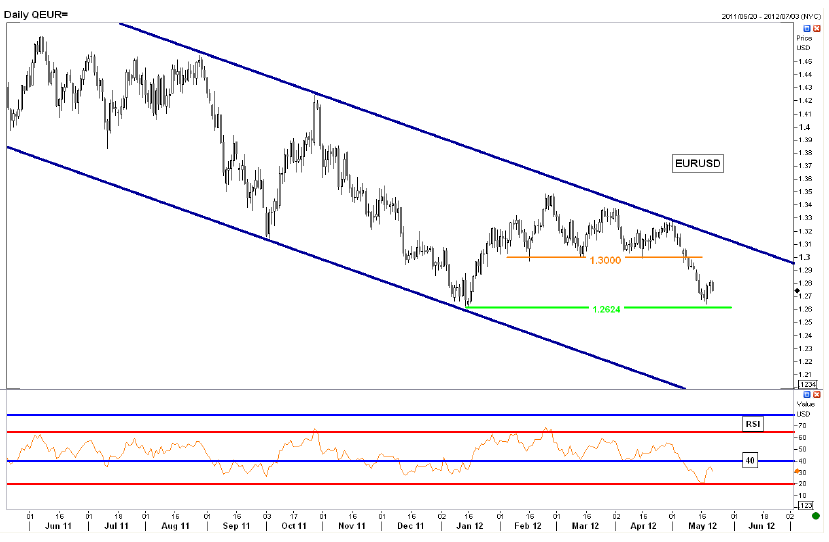
EURUSD: Down again! The low of January 2012 was almost reached and served as a good reason to take some profits up to 1.2824. The downward trend remains strong and rebounds look corrective. The speculative EUR short positions should be protected with stop losses at 1.2830 and/or 1.2885.
USCAD: Clear break on the range to the upside, confirmed the following days. Then, the upward move accelerated to the resistance at 1.0250. Any short term correction should find support at 1.0160 and 1.0135. Next resistances: 1.0310 and 1.0415. MACD buying signal now also given in weekly studies. (chart upon request).
CBR index (commodities): Break of the major support at 292. Nest is 250 (chart upon request)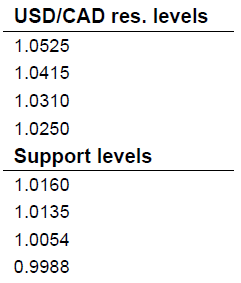
Fixed Income
Bond yields dropped last week as North American stocks posted their worst weekly loss of the year.
. Political turmoil in Europe continues to attract investors’ attention, pushing long term yields lower in the US and in Canada.
. Market activity was slightly more positive on Wednesday after strong Canadian manufacturing shipments and U.S. housing starts.
. On Thursday though, concerns over Greece's financial situation and the growing probability the country will have to leave the euro-zone pushed bond yields and equities lower.
. Friday, Canadian bond yields were mixed as Canada's CPI data for April was slightly higher than market expectations. The short term sector (2y) increased slightly on the news, but the turmoil in Europe kept longer maturities from moving significantly.
The coming week's economic data includes April's existing home sales in the US on Tuesday, as well as Canadian retail sales on Wednesday. Enjoy your week.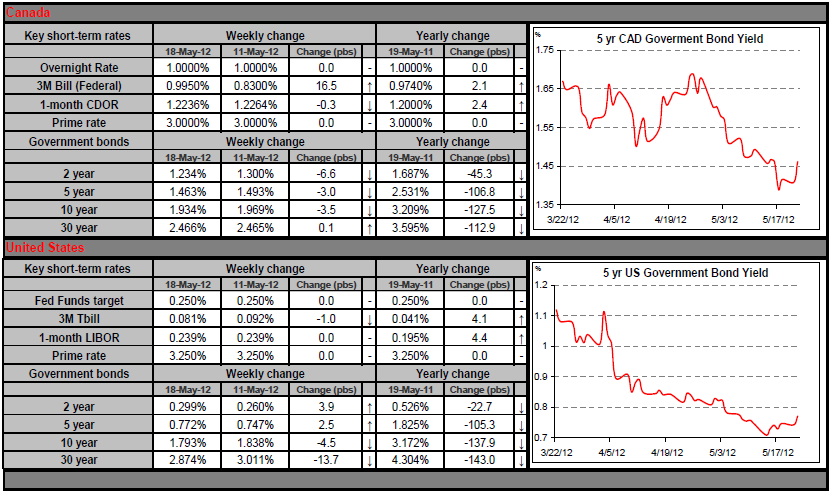
Commodities
The price of crude oil is now trading at its lowest level since last October because of financial difficulties in Greece and that potential risks of contagion to the entire euro region could reduce global oil demand. After a series of disappointing economic statistics from China, yesterday’s comments made by Chinese Prime Minister stating that government could adopt new measures to boost economic growth were favorable to the prices of major commodities. Further reduction in the reserve requirement ratio may soon be announced and it would be well received by investors. Also note the comments in favor of keeping Greece in the euro area by the G8 leaders who gathered Saturday in the United States. Iran just agreed to let western nuclear inspectors into the country and resumption of talks Wednesday between Iran and the 5 +1 group (France, Russia, United States, Britain, Germany and China) could eventually ease sanctions against Tehran. Recall that the European Union embargo against the Iranian oil should be fully implemented as soon as July. Have a nice week!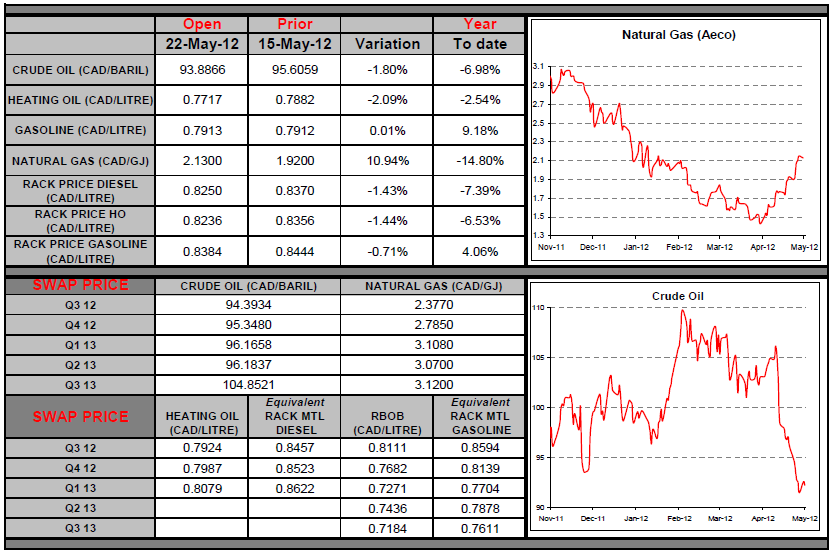
Last Week at a Glance
Canada – In March, factory shipments overshot consensus expectations (+0.4%) by rising 1.9%. The prior month was revised up one tick to -0.2%. Sales in March were up in 13 of the 21 industries, with increases driven primarily by transportation equipment, food and petroleum/coal products more than offsetting losses elsewhere. In volume terms, shipments rose 1.9%, which should support Canadian GDP in March. Wholesale trade rose 0.4% in the month, roughly in line with consensus expectations, driven by vigorous sales of motor vehicles and parts (+2.4%). However, sales excluding these were flat as a sharp drop in the volatile "farm product" category (-5%) offset gains elsewhere. In real terms, wholesale trade held level. In April, Canada’s consumer price index increased 0.4%. Seasonally adjusted, it rose 0.2%. Five of the eight major CPI components saw advances. Prices were up most notably for clothing/footwear (+1.1% seasonally adjusted), but also for food, transportation, recreation, and alcohol/tobacco, albeit to a lesser extent. Prices were flat for the three other categories. The year-on-year inflation rate climbed one tick to 2%, which was one tick higher than the consensus estimate. Core CPI rose 0.4% both seasonally adjusted and not. The year-on-year core inflation rate gained two ticks to 2.1%, which were two ticks higher than expected by consensus. April's inflation report was a bit hotter than consensus expectations, particularly regarding the core rate. That said, inflation is currently tracking close to Bank of Canada estimates for Q2 (1.8% for headline and 2% for core, versus the BoC's 2% and 1.9%, respectively). While the BoC turned more hawkish in April's interest-rate statement, developments since have pared back expectations of rate hikes this year. These include a hugely disappointing February Canadian GDP and the deterioration of the eurozone economic and financial situation. There are just too many risk factors threatening growth at present and, therefore, we continue to expect the BoC to stay put until next year. Separately, Canadian securities transactions data for March showed that foreigners cut C$2 billion worth of Canadian assets from their portfolios. Foreigners added some stocks but trimmed bonds (-C$0.9 billion) and money market instruments (-C$1.4 billion). For Q1 as a whole, there was a net inflow of $6.3 billion, the lowest quarterly tally since 2008.
United States – The CPI was flat in April as lower energy prices offset increases elsewhere. The annual inflation rate fell four ticks to 2.3%, from 2.7% in March. Excluding food and energy, prices rose 0.2%, leaving the year-overyear rate unchanged at 2.3%, the same has last month. Shelter, which accounts for 40% of the core CPI, saw prices gain 0.2% in the month. Sharp price increases were recorded in various categories, including apparel (+0.4%), medical care (+0.4%), new and used vehicles (+0.4 and 1.5%, respectively), education, and tobacco. Yet, with the year-over-year inflation rate decelerating and the U.S. economy growing at subpar, the FOMC would have the leeway to intervene if the international situation were to call for further quantitative easing. Still in April, retail sales grew 0.1%, in line with consensus expectations, after March sales were revised down one tick to 0.7%. Excluding autos (+0.5%), sales climbed 0.1%, one tick below consensus expectations, as gains in furniture, electronics, sporting goods, food and health products offset declines in clothing and general merchandise. Sales of discretionary items (i.e., excluding gasoline, groceries and personal health products) rose for an 11th consecutive month. After a strong performance in 2012Q1, when warmer-than-usual weather and an early Easter pulled some sales away from Q2, it seems that consumers are now taking a breather. With April’s marginal gain, real retail spending growth in Q2 is tracking at roughly 2% annualized, down from Q1’s +5.5% print.
The deceleration is not entirely unexpected given the unseasonably mild winter, the drop in the savings rate in Q1, and apparent softening in the labour market in the month. Again in April, U.S. industrial production bounced back sharply with a consensus-topping 1.1% increase. The previous month’s figure, however, was revised down six ticks to -0.6%. Capacity utilization jumped to 79.2%, its highest mark in four years. Manufacturing output rose 0.6% on higher auto production (+3.9%), more than making up for the prior month's decline. Mining output sprang 1.6%, reversing most of the preceding month's losses. Utilities output swelled 4.5% after a weak spell due to an unseasonably warm winter. Even considering the downward revisions to the prior month’s numbers, the April IP report was better than expected. Industrial output grew at an annualized pace of 5.5% in 2012Q1 and is now tracking at roughly 3.5% in 2012Q2 (because of the weak handoff from March). Auto assemblies soared 46% in Q1 and are tracking at about +23% so far in the quarter, an overall positive for Canadian auto exporters. In May, the Philly Fed Manufacturing Activity Index slipped to -5.8, well below consensus, which expected it to rise to 10.0. This was the Philly’s first negative print since August of last year. The new-orders sub-index sank to -1.2, its lowest point since September of last year. The shipments sub-index, however, rose marginally to 3.5. The employment sub-index sagged to -1.3, its worst showing since June of 2010. The Philly Fed Index was disappointing for the second straight month. That said, we will wait for more data to be released before reaching any conclusions about Q2 U.S. growth, particularly as the Philly has given false signs of a slowdown before (in August of last year, for example). It should be noted that the relatively strong ISM in April and May Empire State Manufacturing Index (up 11 points to 17.1) bode well for decent growth in Q2. In other news, housing starts increased to an annualized pace of 717,000 units in April while business inventories increased 0.3% in March.
Euro area – The eurozone's GDP was flat in Q1 as German expansion offset contractions elsewhere in the zone. Germany grew roughly 2% annualized following a contraction in 2011Q4. France saw no growth after a similarly disappointing Q4. Output in Italy, the Netherlands, the Czech Republic, Cyprus, and Portugal shrank for the third quarter in a row. Spain's GDP pulled back for the second consecutive quarter following a flat 2011Q3. The stagnant eurozone GDP was a bit better than consensus expectations. However, data for the month of April suggest further weakening of economic activity. The Zew indicator for the current economic situation in the eurozone plummeted from -11.2 in April to -60.2 in May. For Germany, the assessment of the current situation remained positive at 44.1 but expectations regarding the German economy slid 12.6 points to 10.8 in May. The France service purchasing managers survey dropped from 50.1 in March to 45.2 in April and the manufacturing survey remained weak at 46.7. In Italy, both the service and manufacturing surveys slumped further to 42.3 and 43.8, respectively. Moreover, the Banque de France monthly bank-lending survey showed that both household and business demand for credit weakened further in April. The situation going into Q2 can be summed up as follows: one country is doing well, a number are either verging on or in recession, while a couple are skirting economic depression.
- English (UK)
- English (India)
- English (Canada)
- English (Australia)
- English (South Africa)
- English (Philippines)
- English (Nigeria)
- Deutsch
- Español (España)
- Español (México)
- Français
- Italiano
- Nederlands
- Português (Portugal)
- Polski
- Português (Brasil)
- Русский
- Türkçe
- العربية
- Ελληνικά
- Svenska
- Suomi
- עברית
- 日本語
- 한국어
- 简体中文
- 繁體中文
- Bahasa Indonesia
- Bahasa Melayu
- ไทย
- Tiếng Việt
- हिंदी
Forex Snapshot: After Short Repreive, Greek Soap Opera Back On
Published 05/24/2012, 01:12 AM
Updated 05/14/2017, 06:45 AM
Forex Snapshot: After Short Repreive, Greek Soap Opera Back On
Major News this Week
Latest comments
Loading next article…
Install Our App
Risk Disclosure: Trading in financial instruments and/or cryptocurrencies involves high risks including the risk of losing some, or all, of your investment amount, and may not be suitable for all investors. Prices of cryptocurrencies are extremely volatile and may be affected by external factors such as financial, regulatory or political events. Trading on margin increases the financial risks.
Before deciding to trade in financial instrument or cryptocurrencies you should be fully informed of the risks and costs associated with trading the financial markets, carefully consider your investment objectives, level of experience, and risk appetite, and seek professional advice where needed.
Fusion Media would like to remind you that the data contained in this website is not necessarily real-time nor accurate. The data and prices on the website are not necessarily provided by any market or exchange, but may be provided by market makers, and so prices may not be accurate and may differ from the actual price at any given market, meaning prices are indicative and not appropriate for trading purposes. Fusion Media and any provider of the data contained in this website will not accept liability for any loss or damage as a result of your trading, or your reliance on the information contained within this website.
It is prohibited to use, store, reproduce, display, modify, transmit or distribute the data contained in this website without the explicit prior written permission of Fusion Media and/or the data provider. All intellectual property rights are reserved by the providers and/or the exchange providing the data contained in this website.
Fusion Media may be compensated by the advertisers that appear on the website, based on your interaction with the advertisements or advertisers.
© 2007-2025 - Fusion Media Limited. All Rights Reserved.
