After such a dramatic week for currencies, and with the reverberations still echoing around the markets, any news events this week are likely to seem tame by comparison, as 2015 continues its electrifying start.
Whilst volatility is welcome, it is generally preferred to be like Goldilocks porridge ‘not too hot and not too cold’, the SNB news on Thursday that it was withdrawing its support of the 1.20 exchange rate against the EUR/USD sent a shock wave across the markets forcing brokers into administration, wiping out trading accounts and invalidating stop loss orders. Whilst such events are rare, they do nevertheless reinforce what we often forget, that trading is an extremely risky business, and even those mechanisms designed to protect our trading capital can, and do fail at such extreme times.
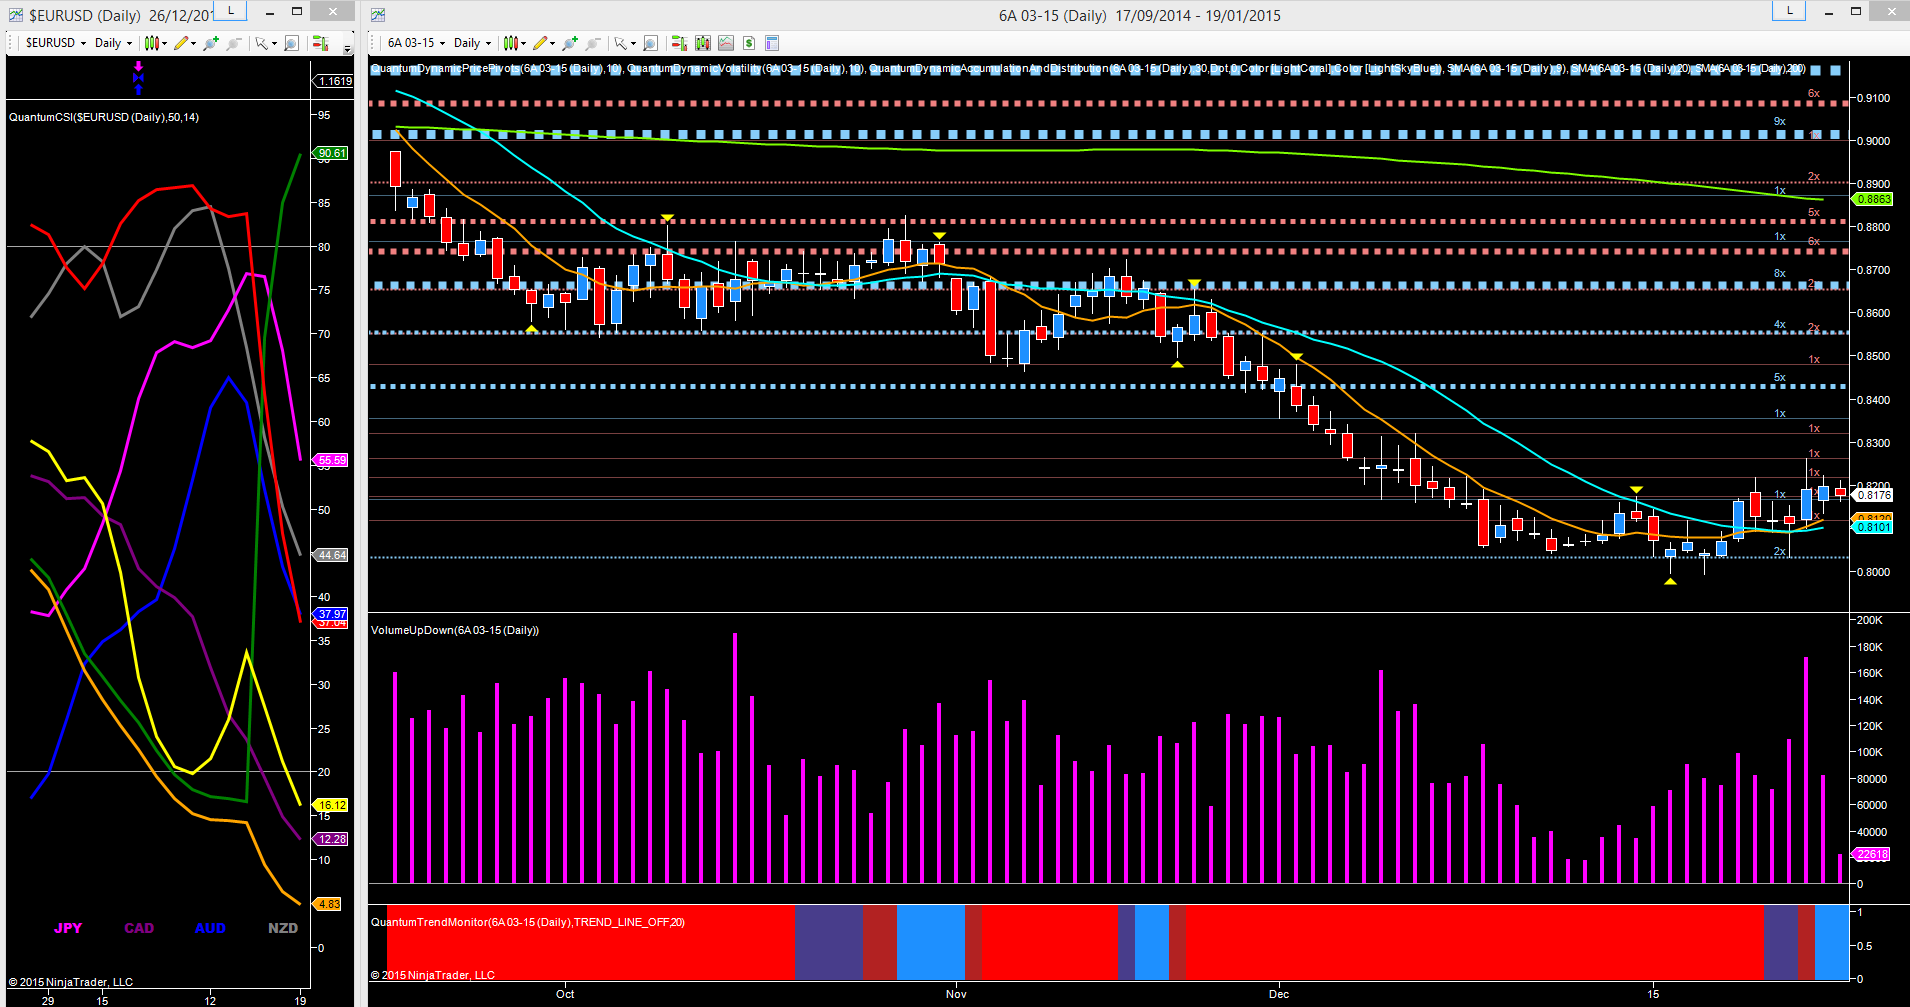
And so on to the week ahead for four of the majors starting with the 6A March contract for the AUD/USD, which found a modicum of bullish momentum last week with the pair continuing to rebase around the platform of support in the 0.8000 area, as shown with the blue dotted line. The news on Thursday saw volume in the pair increase dramatically, but with a deep wick to the upper body suggestive of weakness ahead with the pair failing to close with a wide spread up candle, which is what we should have expected, so a clear anomaly here. This price action indicates the recovery may stall at the 0.8200 region, with a possible retest of the platform of support below once again.

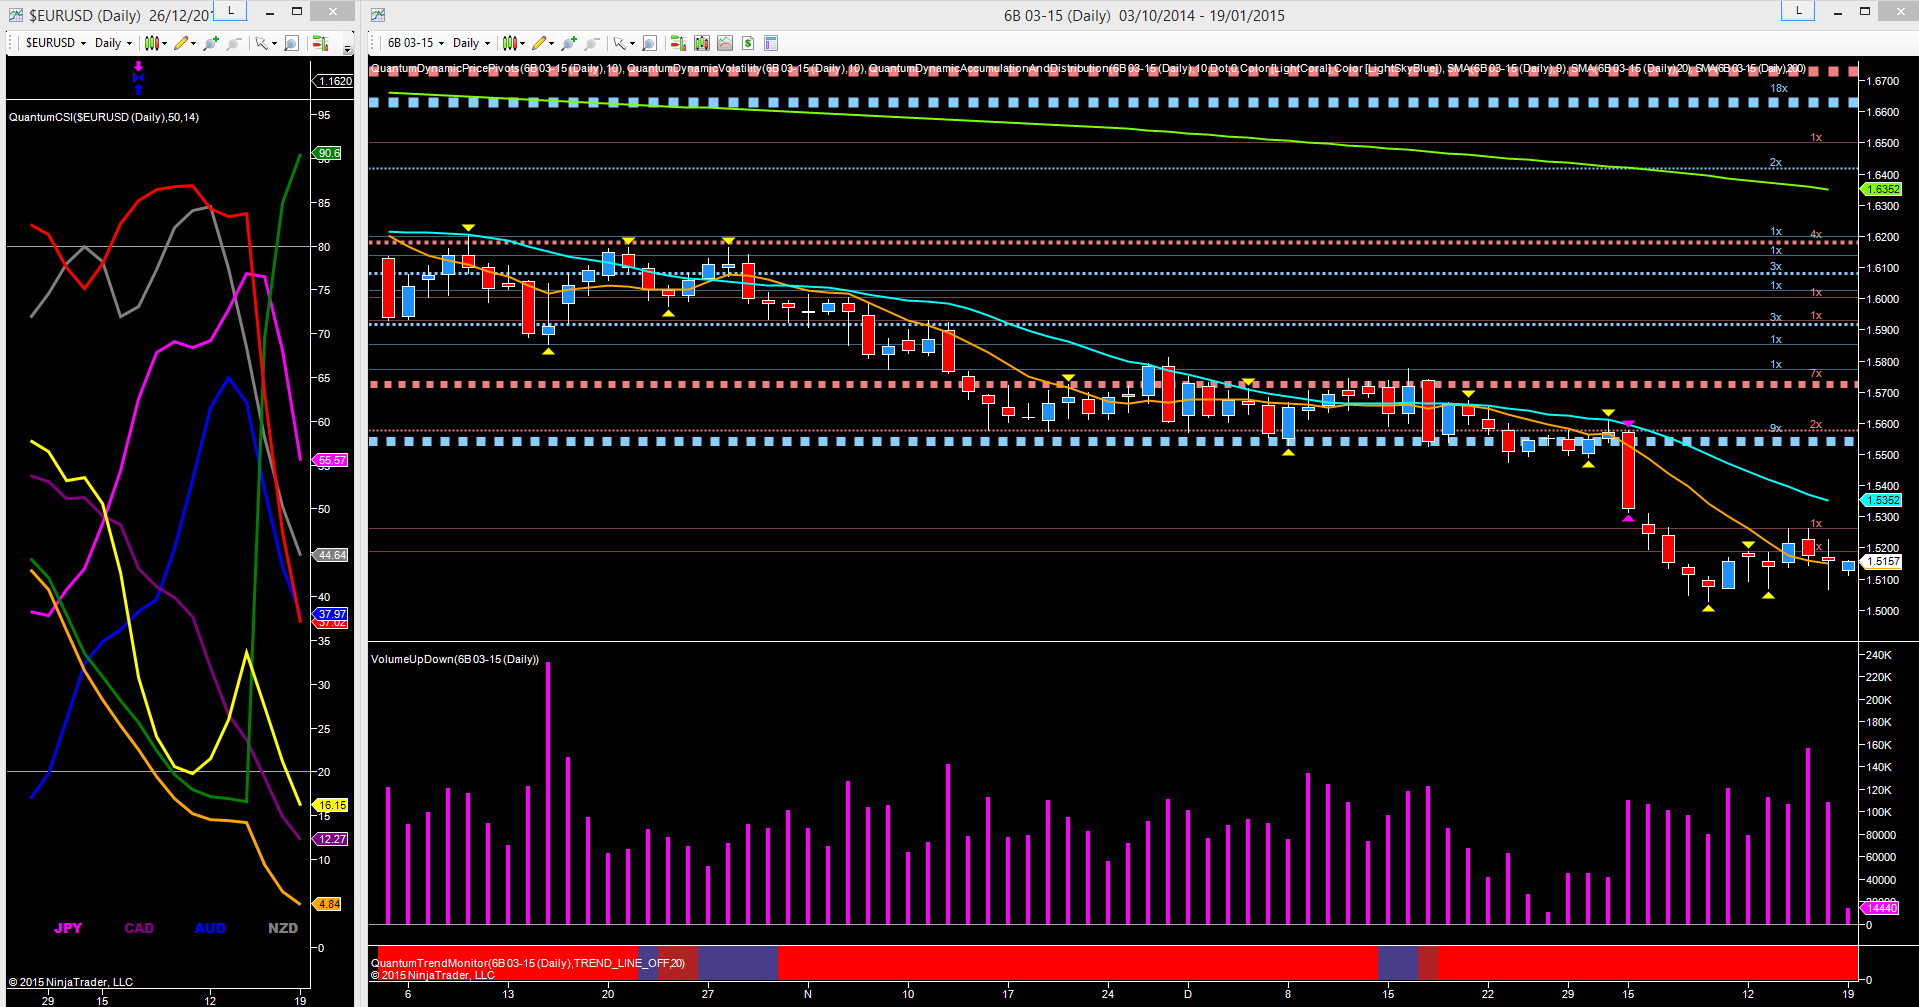
Moving to cable, for the British pound, it was a relatively calm week as the pair continue to consolidate between the 1.5010 and 1.5270 regions, and well defined with the pivot highs and pivot lows. The minor recovery of Wednesday and Thursday both failed at the same level as each attempt to rise ran out of steam. The pair continue to look bearish, and any break below the psychological 1.5000 level will then open the way for a deeper move down to test the next logical level which sits in the 1.4720 region.

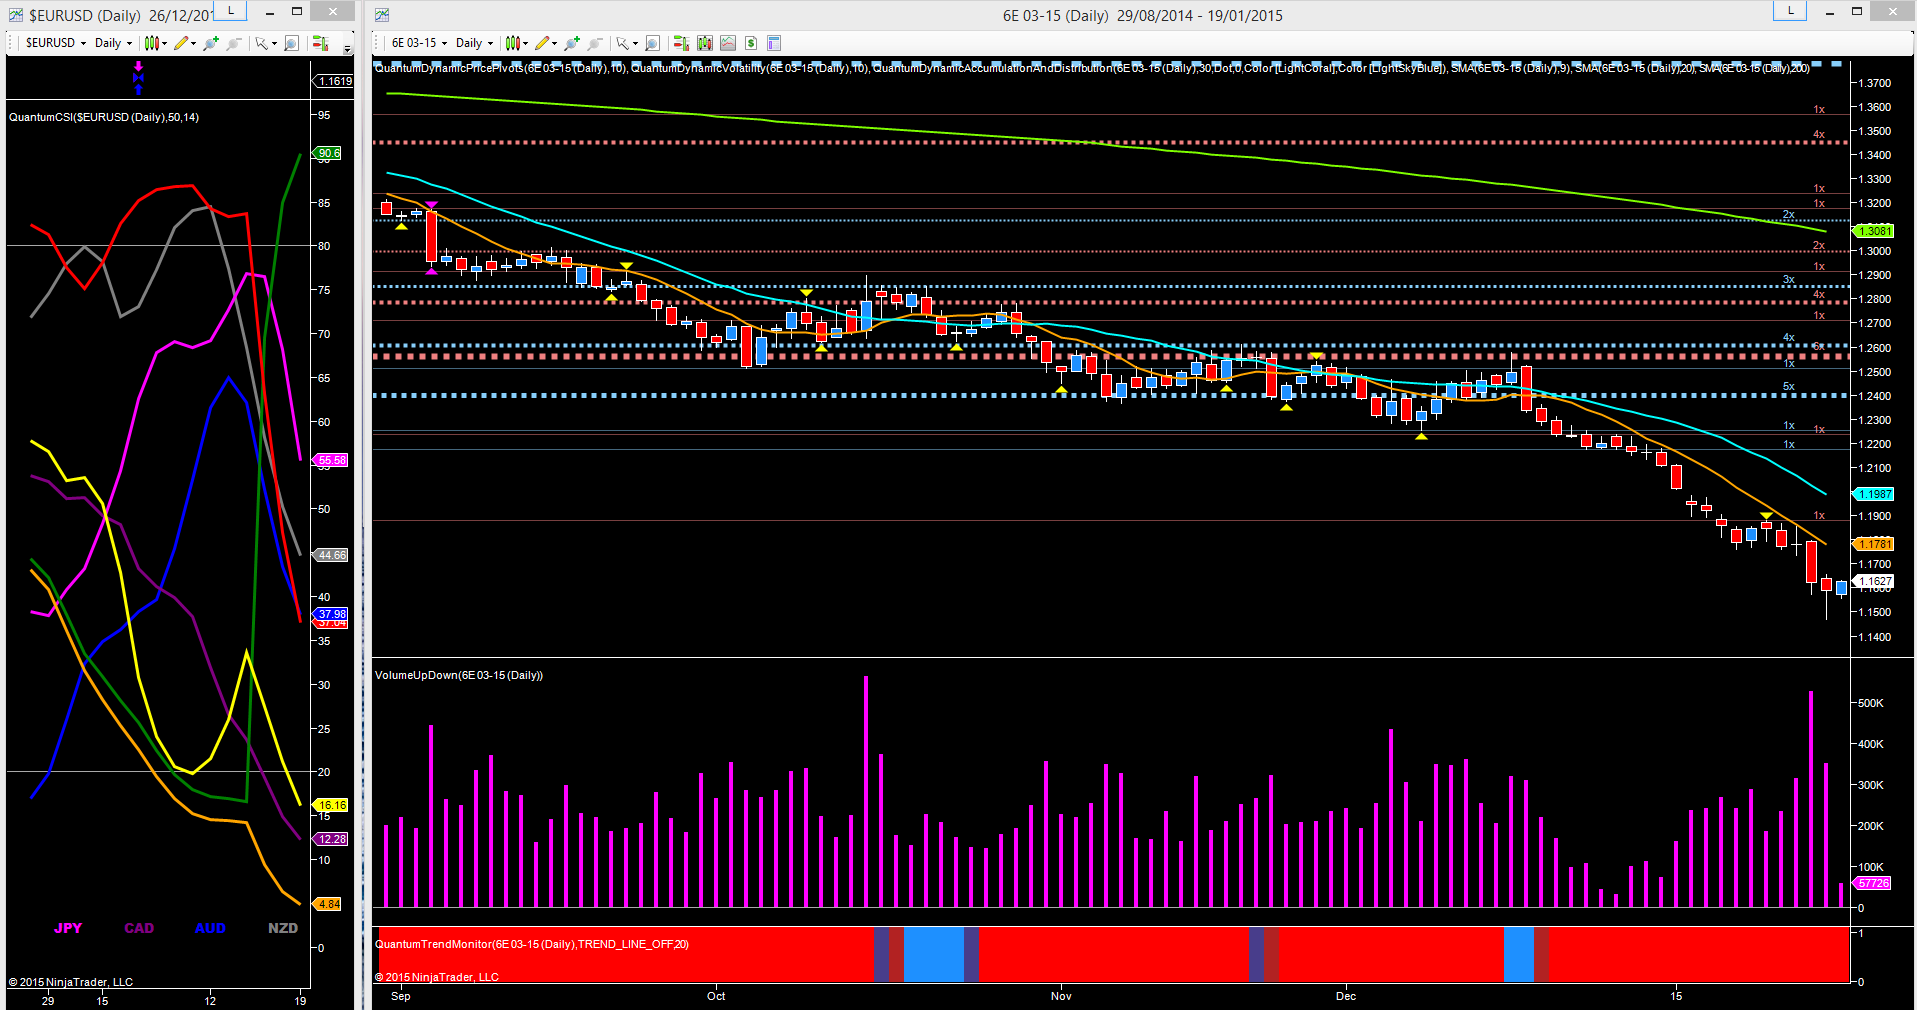
For the single currency, it was another week of bearish price action with the 6E continuing to march South, with Thursday’s wide spread down candle confirmed with heavy selling volume. Friday’s price action saw some muted buying of the euro, with the pair bouncing off the lows of the day to close as a small hammer, suggesting a possible short term pause in the 1.1600 region, before continuing lower once again.

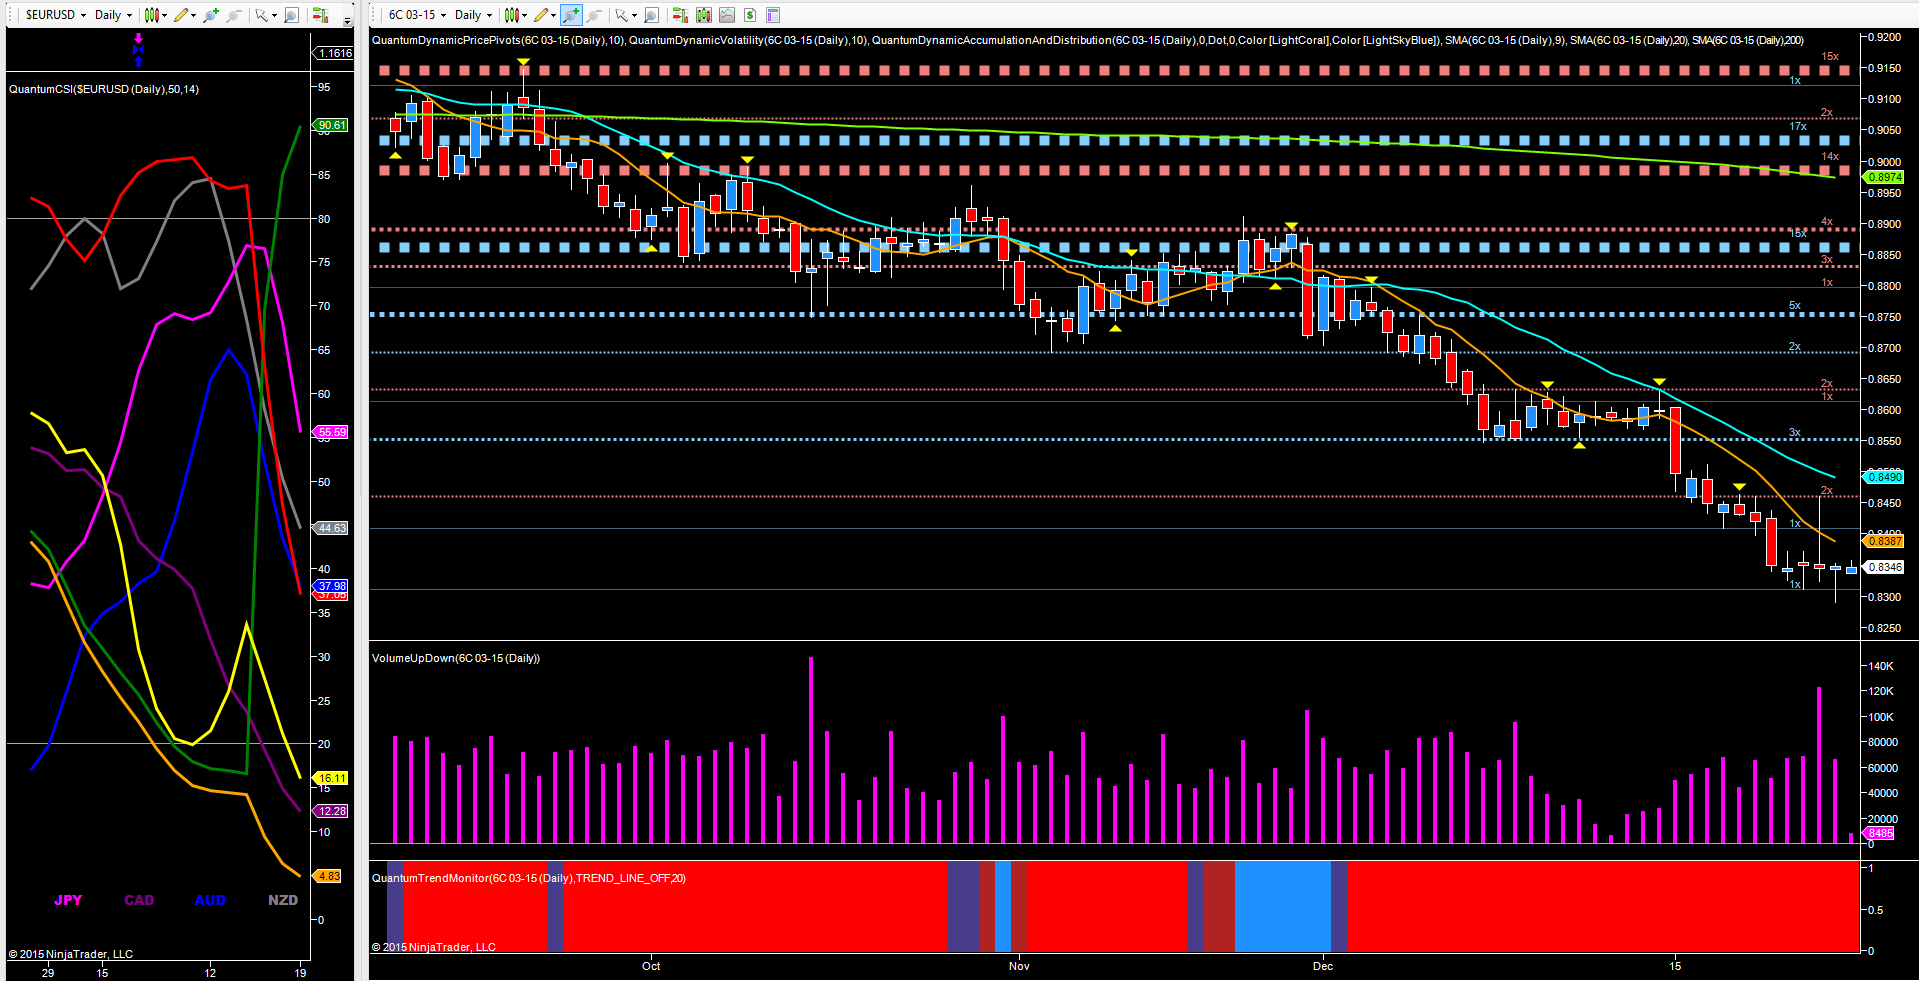
Finally to the 6C, with the Canadian dollar continuing to remain under pressure, both from bullish momentum in the US dollar, and the continuing decline in the price of oil. The price action last week was a re-run of the previous week with the start of the week seeing the pair lurch lower, followed by four days of consolidation.
This was the pattern last week as the pair broke below 0.8400 and are now testing the next level of support in the 0.8310 region. The events on Thursday saw the pair spike higher initially only to close back near the open and confirming once again the bearish sentiment for the pair on high volume. With the US dollar continuing to remain firmly bullish and with oil prices continuing to decline, the outlook for the CAD/USD remains heavily bearish as the Canadian dollar ( the purple line) continues to push deeper into the oversold region on the currency strength indicator to the left.
