Investing.com’s stocks of the week
EURUSD
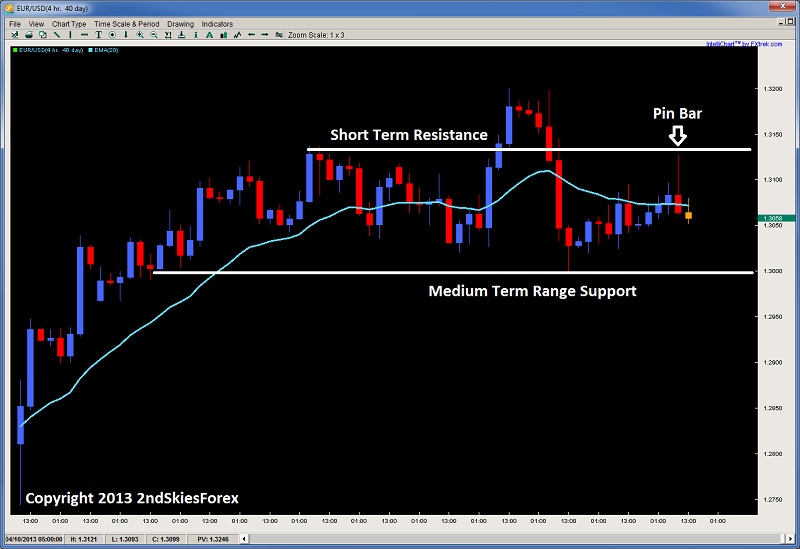
Almost exactly as we described on Thursday, the EUR/USD false break/inside bar scenario played out with the pair popping up to the 1.3121 range forming a pin bar, and then selling off another 70 pips, so hopefully you profited from this as many of our price action students did.
The short term range is now confirmed, with 1.3121 being the upside and the big figure at 1.3000 as the downside. This could be forming a larger HS (head and shoulders pattern) on the daily, which would suggest breakdown. The false break also suggests that any corrective pullbacks up towards the range high should be considered a sell signal targeting the range low, apotential break further which would target 1.2951 and perhaps 1.2850.
 EUR/USD" title="EUR/USD" width="784" height="393">
EUR/JPY
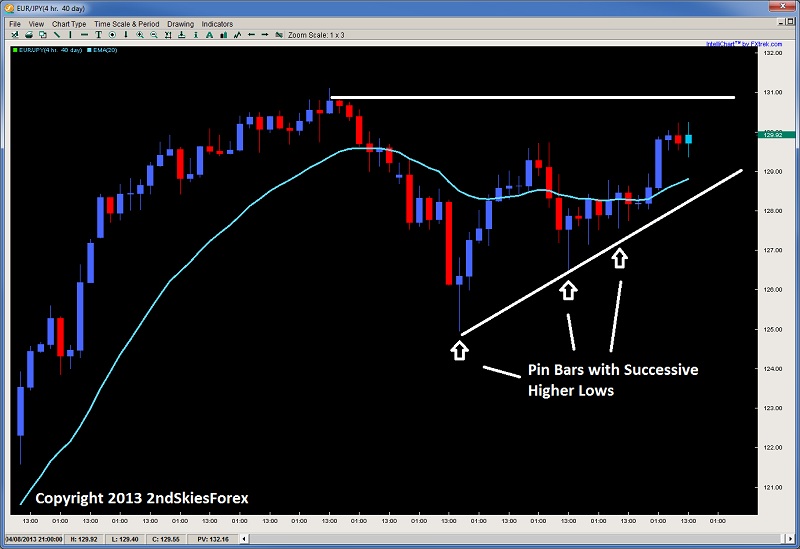
After a sharp sell-off early in the week, the pair recovered nicely off successive pin bars, with each making a HL (higher low). The bullish impulsiveness is building, while the bears are showing less enthusiasm, suggesting a continual building of longs. The next challenge for the bulls is 131 which is the yearly high. Bears can look for price action signals here, while bulls can look for pullbacks towards 128 and 126.50 to add longs on corrective moves lower.
 EUR/JPY" title="EUR/JPY" width="756" height="393">
Crude Oil
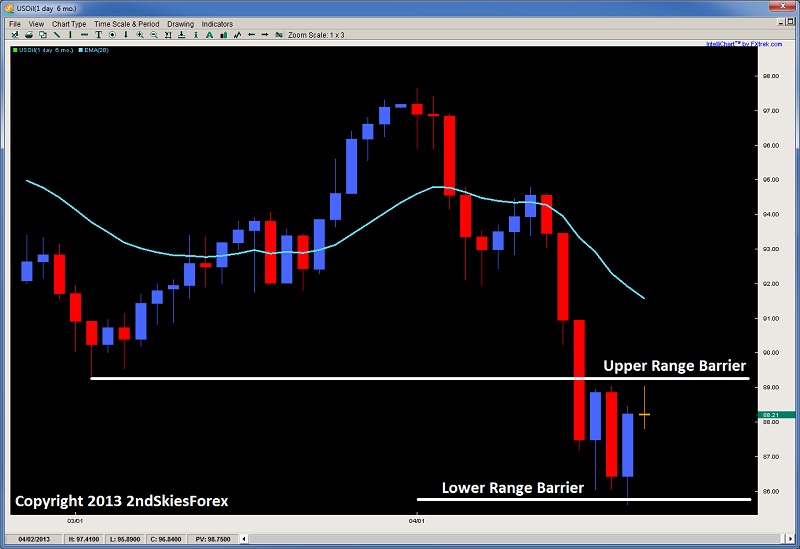
After making a marginal break below $86, the commodity reversed consistently on Thursday to end the week with some bullishness to it. The short term range between $89 and $86 will determine the next victor. A break to the upside targets $91.50/$92, while a break back below puts $85 under pressure so observe intra-day price action on the 1hr charts for clues.

Dax 30
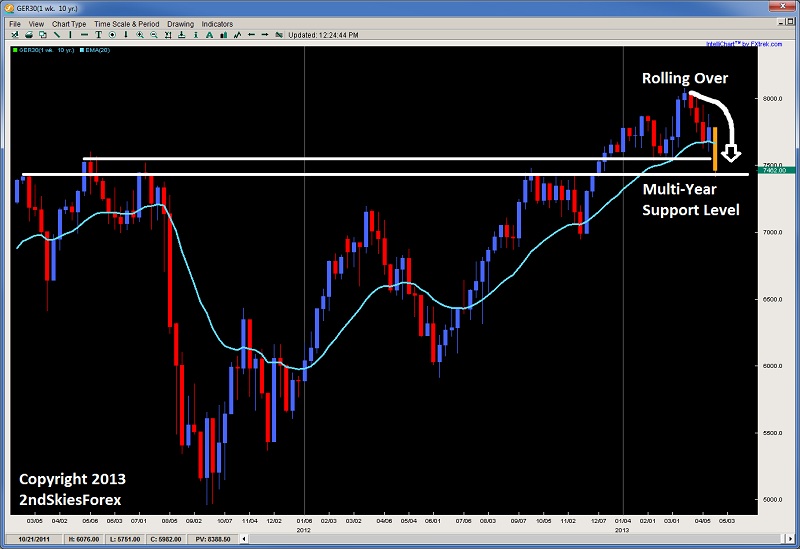
Structurally, many of the European indices are starting to show stress and likely breakdown. The stalwart of the union has been the strongest economy being Germany. However, the Dax just suffered one is its worst losing weeks in over a year. In the weekly chart below, you can see we just broke a major low for the year at 7550, and are barely holding key multi-year support level at 7460. I’ll look for corrective pullbacks towards 7550 to get short, targeting 7460 and a potential break lower towards 7200 and 7000. If this short with a tight stop fails, then I'll look for a pullback higher to sell as the index looks to be turning over.

Original post
Almost exactly as we described on Thursday, the EUR/USD false break/inside bar scenario played out with the pair popping up to the 1.3121 range forming a pin bar, and then selling off another 70 pips, so hopefully you profited from this as many of our price action students did.
The short term range is now confirmed, with 1.3121 being the upside and the big figure at 1.3000 as the downside. This could be forming a larger HS (head and shoulders pattern) on the daily, which would suggest breakdown. The false break also suggests that any corrective pullbacks up towards the range high should be considered a sell signal targeting the range low, apotential break further which would target 1.2951 and perhaps 1.2850.
 EUR/USD" title="EUR/USD" width="784" height="393">
EUR/JPY
After a sharp sell-off early in the week, the pair recovered nicely off successive pin bars, with each making a HL (higher low). The bullish impulsiveness is building, while the bears are showing less enthusiasm, suggesting a continual building of longs. The next challenge for the bulls is 131 which is the yearly high. Bears can look for price action signals here, while bulls can look for pullbacks towards 128 and 126.50 to add longs on corrective moves lower.
 EUR/JPY" title="EUR/JPY" width="756" height="393">
Crude Oil
After making a marginal break below $86, the commodity reversed consistently on Thursday to end the week with some bullishness to it. The short term range between $89 and $86 will determine the next victor. A break to the upside targets $91.50/$92, while a break back below puts $85 under pressure so observe intra-day price action on the 1hr charts for clues.

Dax 30
Structurally, many of the European indices are starting to show stress and likely breakdown. The stalwart of the union has been the strongest economy being Germany. However, the Dax just suffered one is its worst losing weeks in over a year. In the weekly chart below, you can see we just broke a major low for the year at 7550, and are barely holding key multi-year support level at 7460. I’ll look for corrective pullbacks towards 7550 to get short, targeting 7460 and a potential break lower towards 7200 and 7000. If this short with a tight stop fails, then I'll look for a pullback higher to sell as the index looks to be turning over.

Original post
