GBPUSD – Shallow Pullback + Pin Bar
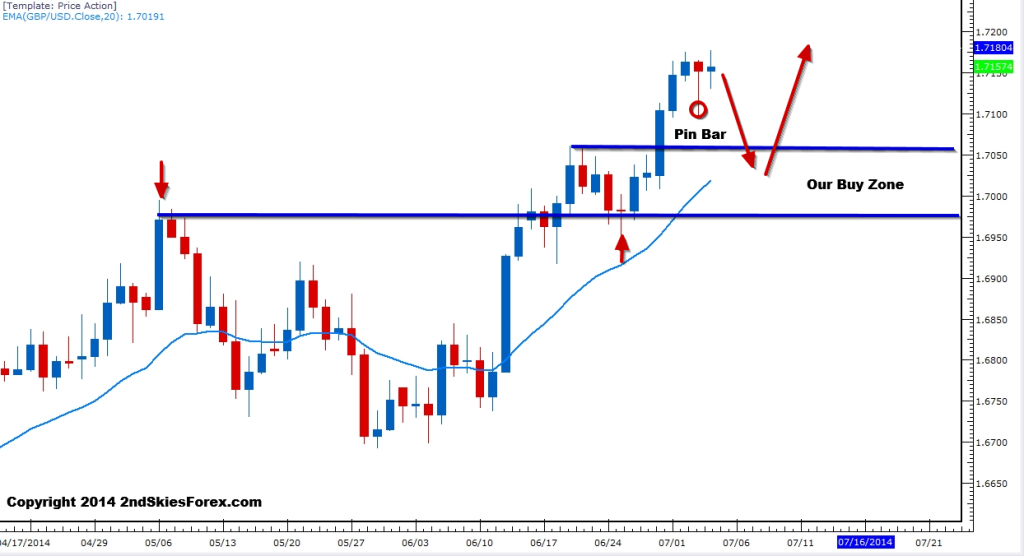
The cable consolidated over the last few days near the highs forming a daily pin bar on Thursday, then chopping around on Friday which was a low volume day due to the July 4th holiday and US markets being closed. The daily pin bar shows buyers are still in control and willing to buy dips intra-day even at such high prices. This all paints a picture of the pair climbing higher in the coming week.
For now, we are maintaining a bullish bias and will look to get long in our buy support zone around 1.7060 – 1.6975. Upside targets would be the 1.7160 current highs, and an eventual move to 1.7250 and 1.7475.
GBPJPY – Forms Daily Pin Bar, Likely Pullback
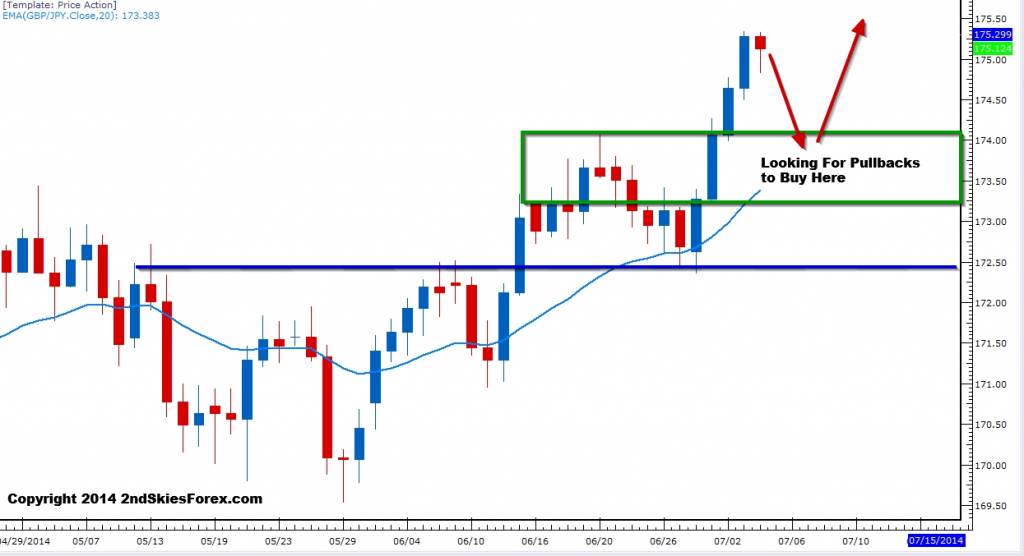
Also forming a pin bar on the daily time frame, the GBPJPY had its first bearish close in 5 days, but was bought up intra-day as well, showing a bullish under-pinning to the pair.
I’d be open to buying a breakout, but on the 4hr chart you can see the trend is turning more volatile, suggesting pullbacks are the soup de jour. So we’ll wait for a pullback towards the 174-173.60 region before getting long. Another option I’d be open to would be we have a convincing breakout above 175.50 to start the week, then a corrective pullback to the 175.30 level to get the next leg up, which should be for at least 250-300+ pips.

Gold – Corrective Structure Still in Place = Bullish Bias
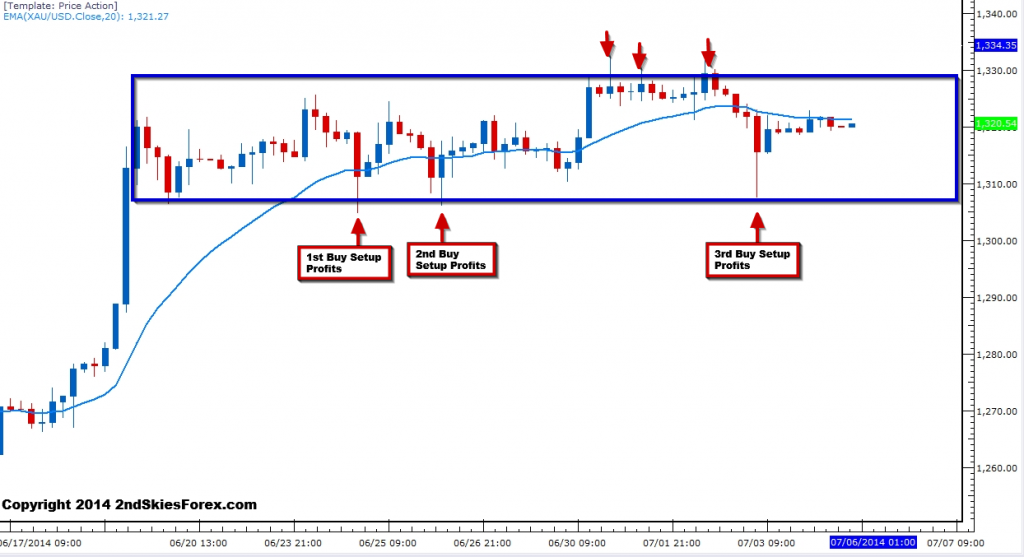
Since June 20th, gold has been maintaining a bullish flag / bullish corrective structure, holding several times above the key 1306 level we’ve talked about in prior commentaries. In our members commentary last Thursday, we suggested buying off the 1306 support area (4hr chart below), which held again with buyers stepping in and causing another 1500 point bounce, so congrats to those who profited from this.
Both short and medium term bulls will likely have stops placed below 1300, so maintain a bullish bias while we are above it. If the precious metal can take out the 1334 highs last week, then the next upside target will likely be 1351. Note we have not had a close below the daily 20 ema and dynamic support since June 17th and the pin bar on the daily chart.

Dow Jones 30 – Corrective Pullback Suggests New Highs Coming
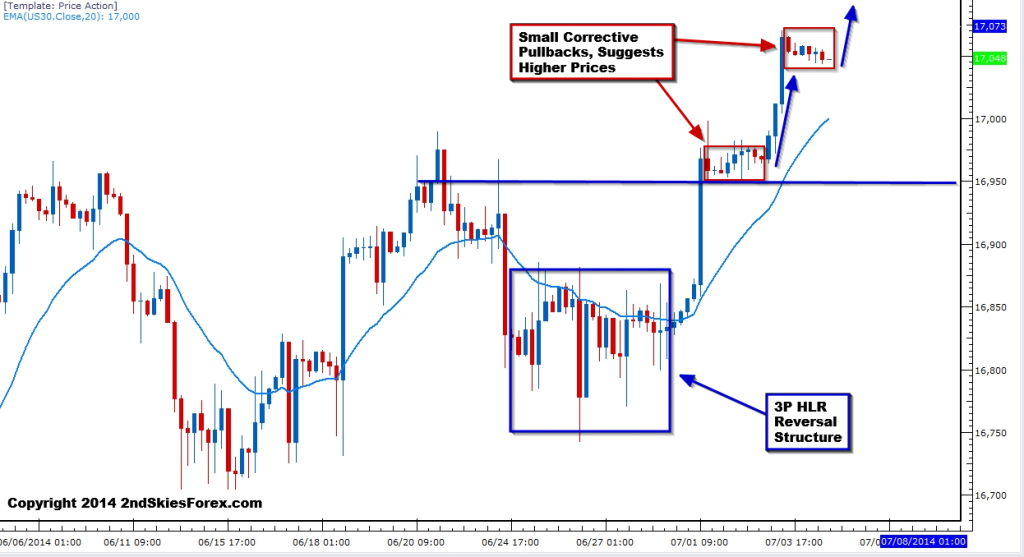
After a 3P HLR setup via the 4hr time frame on June 27th profited, the US index has formed two impulsive legs up, both followed by weak corrective pullbacks. This most recent corrective pullback is at a flat/obtuse angle, suggesting the selling pressure is quite weak and muted.
I’m suspecting a breakout higher is likely and we’ll print new all time highs this week, so am maintaining a bullish bias. I’d be open to taking a breakout if an impulsive move starts from the bottom of this corrective structure. If not, any pullbacks towards 17,000-16,975 should be viewed as buying opportunities to trade with the trend. Keep holding longs while above 16,950 and look for 17,100 and 17,200 to be likely hit this week.


