The following data cover the latest from the CFTC’s Commitment of Traders as reported by Oanda from the week of from Monday, February 8, 2016. From Oanada:
“The Commitments of Traders (COT) is a report issued by the Commodity Futures Trading Commission (CFTC). It aggregates the holdings of participants in the U.S. futures markets (primarily based in Chicago and New York), where commodities, metals, and currencies are bought and sold. The COT is released every Friday at 3:30 Eastern Time, and reflects the commitments of traders for the prior Tuesday.”
In this edition of “Forex Critical” I focus on notable changes in the currency positioning of non-commercial traders, also known as speculators. While speculators do not necessarily drive market action, they can provide good proxies for the market sentiment that DOES drive currency moves. Wherever meaningful, my snapshots of currency charts show U.S. dollar currency pairs to provide a common point of reference and a direct comparable to the charts provided by Oanda (the yellow line in the positioning charts). These charts come from FreeStockCharts.com. I provide Oanda’s embeded tool at the end of this post for your convenience.
Summary
In general, what was hot is not hot now. Speculators have reversed positioning across major currencies. In some cases, fundamental and lasting changes could be underway. This is truly a critical juncture for forex markets in terms of market sentiment. The common theme is a general unwind from bullish sentiment toward the U.S. dollar.
The Australian Dollar
Speculators have again retreated on short positions. Net positioning sits almost at zero now. The lack of interest in bearish positions supports my expectation that the Australian dollar (N:FXA) is likely to bounce in a trading range against the U.S. dollar (DXY0) for the time-being. I continue to prefer to stay away from trading this pair until a definitive move occurs – for example, a breakout above 200-day moving average (DMA) resistance.
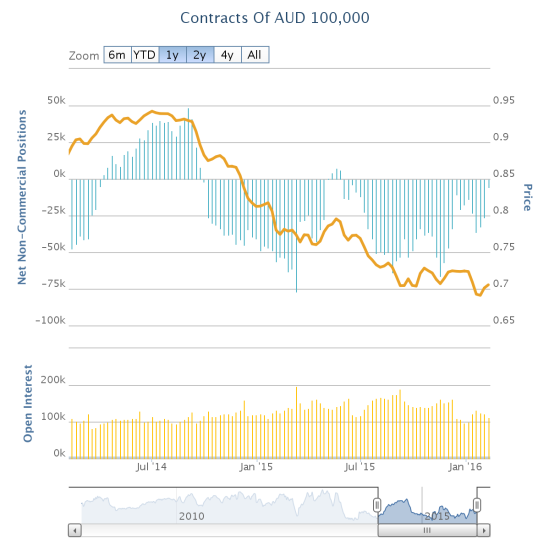
Speculators have mostly stayed bearish against theAustralian dollar since October, 2014. As they retreat from net shorts, the Australian dollar has stabilized.
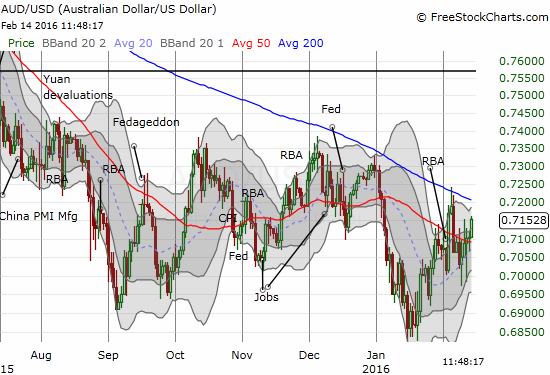
AUD/USD is aiming for a retest of resistance at its 200DMA. The pair has churned a lot but gone almost nowhere since late JanuaryI
The British pound
For the first time since mid-December, speculators significantly scaled back their net shorts against the British pound (N:FXB). While net shorts are still relatively high, this pullback supports my contention that the British pound is finally bottoming against the U.S. dollar. While I am long GBP/USD, I remain very wary of a fresh sell-off in the pound driven by fears related to the UK’s potential exit from the European Union (EU). As a result, for shorter-term trades I flip in and out of short GBP/JPY and GBP/AUD positions.
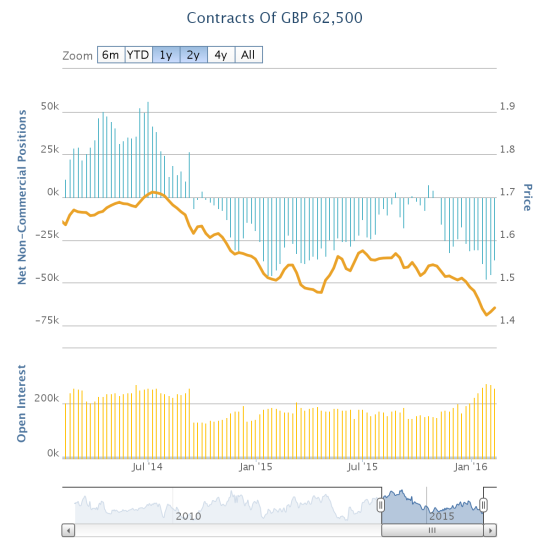
Like the Australian dollar, the British pound has mainly suffered the wrath of bearish speculators since October, 2014. A sharp renewal of short interest seems to be coming to an end.
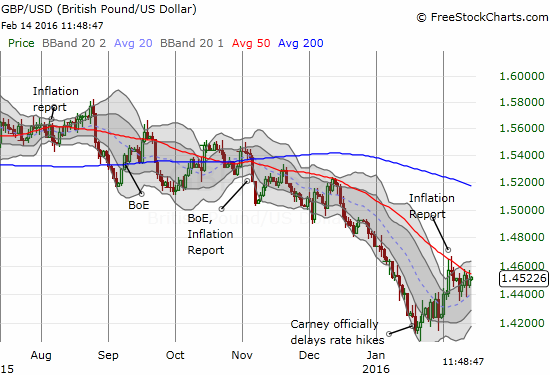
GBP/USD has still failed to break through 50DMA resistance. A rising 20DMA supports an eventual breakout, and such a move could mark a fundamental change in trading sterling.
The Canadian dollar
For the second week in a row, speculators have reduced net shorts against the Canadian dollar (N:FXC). The Bank of Canada failed to deliver another interest rate cut and oil has experienced a few sharp lurches upward. Perhaps the risk/reward balance is finally tipping away from continuing to ride short positions. I have turned my focus to shorting USD/CAD as the technicals seem to confirm a significant breakdown from what was once support from the 50-day moving average (DMA).
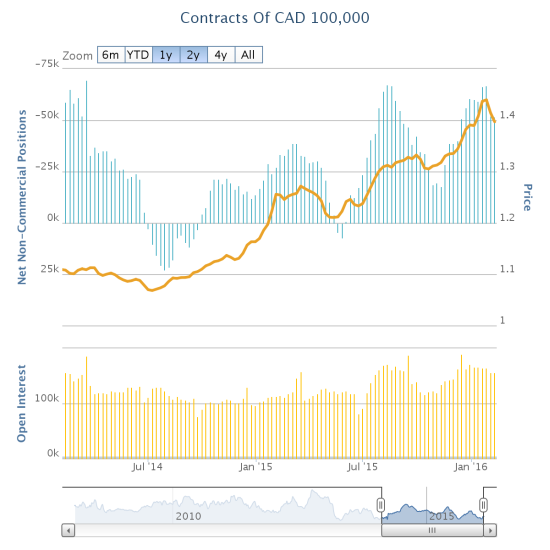
Net shorts against the Canadian dollar have come in waves over the last two years. The latest wave seems to be coming to an end.
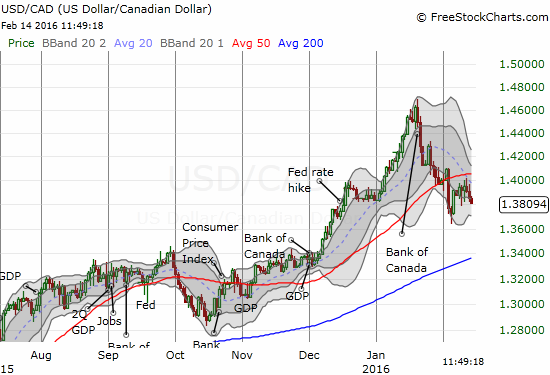
USD/CAD scored a significant breakdown of 50DMA support as part of a larger post-Bank of Canada sell-off. The pair looks ready to resume the sell-off after confirming 50DMA resistance.
The euro
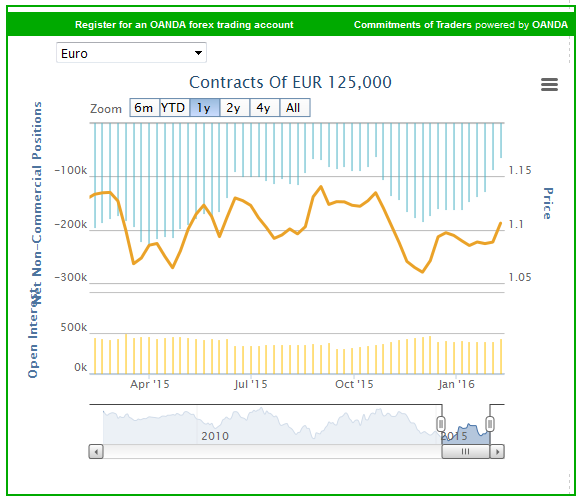
Speculators have been retreating from net short positions against the euro (N:FXC) ever since such positions reached a peak at the end of November. Net shorts have not been this low since mid-October. The euro reached a local peak against the U.S. dollar at that time. While I continue to wait for a fresh sell-off on the euro, I have focused euro longs on EUR/AUD and EUR/JPY.
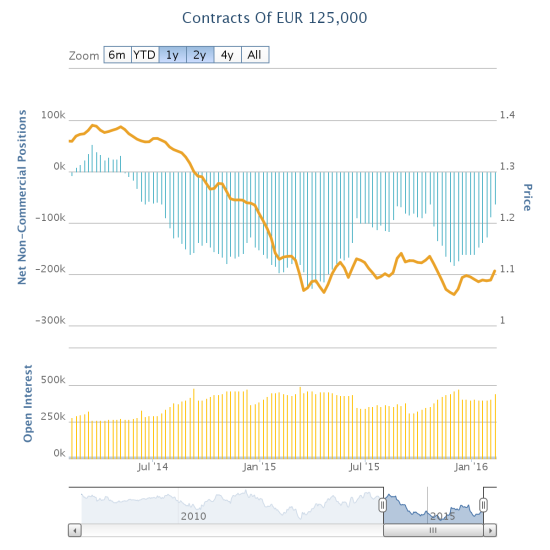
Speculators have been solidly bearish on the euro since May, 2014. The pullback from the last peak in November is the most significant wavering of bearish sentiment since the peak in March, 2015.
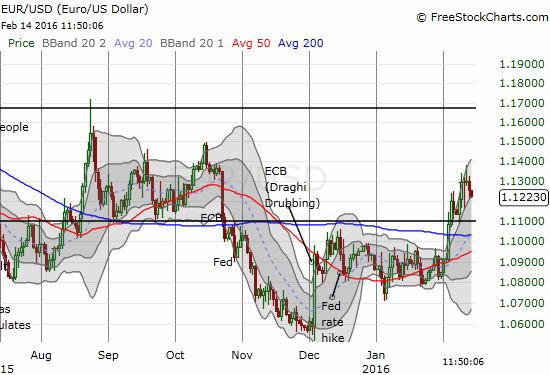
EUR/USD scored a major breakout against the U.S. dollar this month as traders seem to pullback on carry trades. The February breakout came off a strong base of 2 months of consolidation which itself followed a major Draghi-driven bounce from lows.
Japanese yen
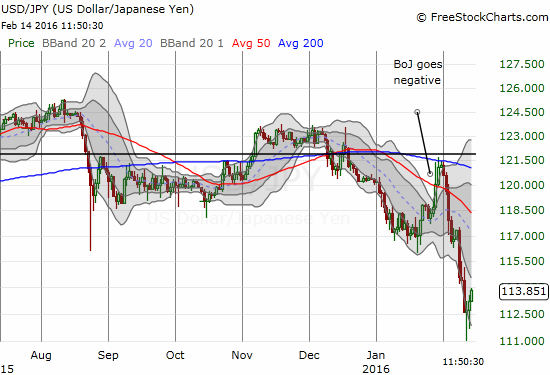
It looks like speculators treated the Bank of Japan (BoJ)-driven plunge in the yen (N:FXY) as a buying opportunity. Net longs increased marginally in the wake of Japan going negative. If the BoJ intended to scare traders away from long yen positions, the policy has completely failed so far. As a reminder, speculators were last net long the Japanese yen in October, 2012.
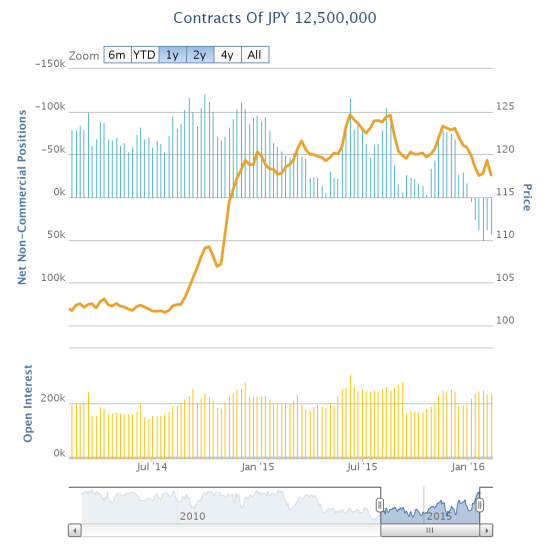
The sentiment shift in the Japanese yen is the most significant of the major currencies reviewed here.
USD/JPY has significantly broken down. A bounce is finally underway but buyers have a LOT of damage to repair.
Be careful out there!
Full disclosure: short EUR/USD, long USD/JPY, long GBP/USD, long FXC

