We are a people of language. The way we talk about a thing affects how we think about it. This is something that behavioral economists are very aware of; and even more so, marketers. There is a reason that portfolio “insurance” was such a popular strategy. Language matters. When we call a market decline a “correction,” we tend to want to buy it; when we call it a “crash” or a “bear market”, we tend to want to sell it.
And so as the “arctic vortex” reaches its cold fingers down from the frozen northland, it is really hard for us to think about economic “overheating.” Even though economic overheating doesn’t lead to inflation, I really believe that it is hard for investors to worry about inflation (the “fire” in the traditional “fire versus ice” economic tightrope that central bankers walk) when it is so. Darn. Cold.
But nevertheless, we can take executive notice of certain details that may suggest, overheating or not, inflation pressures really are building. I have been writing for some time about how the recent rapid rise in housing prices was eventually going to pass through to rents, and although the lag was a couple of months longer than it has historically been, it seems to be finally happening as an article in today’s Wall Street Journal suggests. This is significant for at least two reasons. The first is that housing costs are a very large part of the consumption basket for the average consumer, so any acceleration in those prices can move the otherwise-ponderous core CPI comparatively quickly. The second reason, though, is more important. Over the last couple of years, as housing prices have improbably spiked again and inventories have declined sharply, many observers have pointed out the presence of an institutional element among home purchasers. That is to say that homes have been bought in large numbers not only by individuals, but by investors who saw an inexpensive asset (they sure solved that problem!). And some analysts reasoned that the prevalence of these investors might break the historical connection between rents and home prices, at least in the short run, in the same way that a sudden influx of pension fund money could change the relationship between equity prices and earnings (that is, P/Es).
In the long run, of course, this is unlikely, but to the extent it happens in the short run it could delay the upturn in core inflation for a long time. But recent indications, such as that article referred to above, are that this effect is not as large as some had thought. The substitution effect does work. Higher home prices do cause rents to rise as more potential buyers choose to rent instead. It is a question for econometricians in the next decade whether the institutions had a large and lasting effect, or a short and ephemeral effect, or no effect at all. But what we can begin to say with a bit more confidence is that this influx of investors did not remove the tendency of home prices and rents to move together, with a lag.
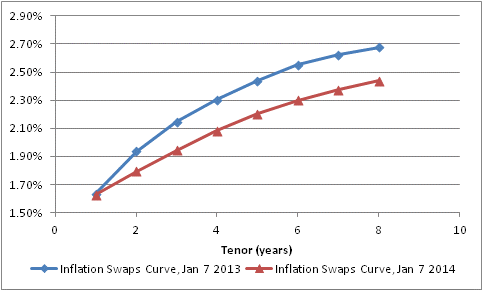
On to other matters. The market curve for inflation has remained remarkably static for a long time. It is relatively steep, and perennially seems to forecast benign inflation for the next couple of years before headline inflation becomes slightly less-benign (but still not high) a few years down the road. The chart below (Source: Enduring Investments) shows the first eight years of the inflation swaps curve from today, and one year ago.
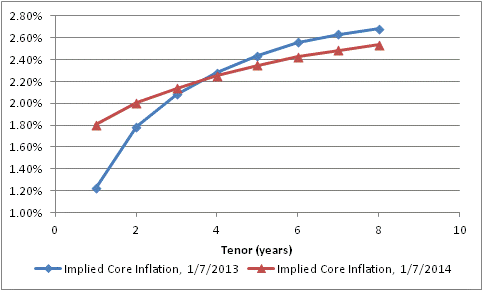
If that was the only story, I probably wouldn’t bother mentioning it. But inflation swaps settle to headline CPI, like TIPS and other inflation-linked bonds do; however, a fair amount of the volatility in headline inflation comes from movements in energy. This is why policymakers and prognosticators look at core inflation. You cannot directly trade core inflation yet, but we can extract expected energy inflation (implied by other markets) from the implied headline inflation rates and derive “implied core inflation swaps” curves. And here, we find that the relatively static yield curves seen above hide a more interesting story. The chart below (Source: Enduring Investments) shows these two curves as of today, and one year ago.
At the beginning of 2013, investors has just experienced a 1.94% rise in core prices (November to November, which is the data they would have had at the time), yet anticipated that core inflation would plunge to only 1.22% in 2013. They actually got 1.72% (as of the latest report, so still Nov/Nov). Now, investors are anticipating about 1.8% over the next 12 months – I am abstracting from some lags – but expect that inflation will ultimately not rise as much as they had feared at this time last year.
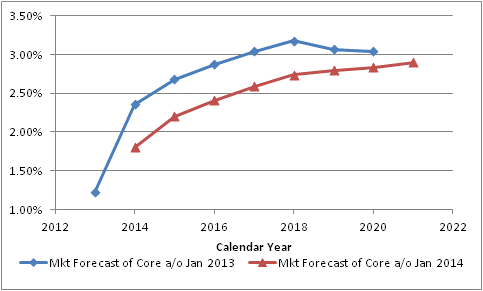
Another way to look at this change is to map the implied forward core inflation rates onto the years they would apply to. The chart below (Source: Enduring Investments) does that. 
The blue line shows the market’s forecast of core inflation as of January 7th, 2013, year by year. So investors were implicitly saying that core CPI would be 1.22% in 2013, 2.36% in 2014, 2.68% in 2015, 2.87% in 2016, and so on. One year later, the forecast (in red) for 2014 has come down to 1.80%, the forecast for 2015 has declined to 2.20%, the forecast for 2016 has dropped to 2.41%, etcetera.
Has this happened because inflation surprised to the downside in 2013? Hardly. As I just noted, the market “expected” core inflation of 1.22% in 2013 and actually got 1.72%. And yet, investors are pricing higher confidence that inflation will stay low – remaining basically unchanged in 2014 before rising very slowly thereafter – and in fact won’t seriously threaten the Fed’s core mission basically ever.
As I wrote yesterday, we need to tread carefully around consensus. Now, some investors might prefer to be non-consensus by anticipating and investing for deflation in the out years, but taking the whole of the information I look at and model I think the more dangerous break with consensus would be a more-rapid and more-extreme rise in core inflation. I do not think that this economically-cold pricing environment will continue into what is essentially a monetary summer.
- English (UK)
- English (India)
- English (Canada)
- English (Australia)
- English (South Africa)
- English (Philippines)
- English (Nigeria)
- Deutsch
- Español (España)
- Español (México)
- Français
- Italiano
- Nederlands
- Português (Portugal)
- Polski
- Português (Brasil)
- Русский
- Türkçe
- العربية
- Ελληνικά
- Svenska
- Suomi
- עברית
- 日本語
- 한국어
- 简体中文
- 繁體中文
- Bahasa Indonesia
- Bahasa Melayu
- ไทย
- Tiếng Việt
- हिंदी
Economic Overheating As Forecast Turns Cold
Published 01/08/2014, 12:11 AM
Updated 02/22/2024, 09:00 AM
Economic Overheating As Forecast Turns Cold
Latest comments
Loading next article…
Install Our App
Risk Disclosure: Trading in financial instruments and/or cryptocurrencies involves high risks including the risk of losing some, or all, of your investment amount, and may not be suitable for all investors. Prices of cryptocurrencies are extremely volatile and may be affected by external factors such as financial, regulatory or political events. Trading on margin increases the financial risks.
Before deciding to trade in financial instrument or cryptocurrencies you should be fully informed of the risks and costs associated with trading the financial markets, carefully consider your investment objectives, level of experience, and risk appetite, and seek professional advice where needed.
Fusion Media would like to remind you that the data contained in this website is not necessarily real-time nor accurate. The data and prices on the website are not necessarily provided by any market or exchange, but may be provided by market makers, and so prices may not be accurate and may differ from the actual price at any given market, meaning prices are indicative and not appropriate for trading purposes. Fusion Media and any provider of the data contained in this website will not accept liability for any loss or damage as a result of your trading, or your reliance on the information contained within this website.
It is prohibited to use, store, reproduce, display, modify, transmit or distribute the data contained in this website without the explicit prior written permission of Fusion Media and/or the data provider. All intellectual property rights are reserved by the providers and/or the exchange providing the data contained in this website.
Fusion Media may be compensated by the advertisers that appear on the website, based on your interaction with the advertisements or advertisers.
© 2007-2025 - Fusion Media Limited. All Rights Reserved.
