
Ford Motor Co. (NYSE:F) posted adjusted earnings per share of 39 cents in the fourth quarter of 2017. The reported figure was 9 cents higher than the year-ago figure. However, earnings missed the Zacks Consensus Estimate of 42 cents per share.
During the quarter, adjusted pre-tax profit came in at $1.7 billion, reflecting a decrease of $0.4 billion from the year-ago quarter.
Fourth-quarter net income came in at $2.4 billion, reflecting an increase of $3.2 billion from the year-ago quarter.
During the quarter, Ford logged automotive revenues of $41.3 billion. The Zacks Consensuses Estimate for revenues was $37.2 billion.
For full-year 2017, adjusted earnings per share came in at $1.78, increasing 2 cents from 2016. The Zacks Consensuses Estimate for revenues for 2017 was $1.82.
For full-year 2017, revenues came in at $156.8 billion, reflecting an increase of $5 billion from 2016. The Zacks Consensuses Estimate for revenues for 2017 was $147.5 billion.
Ford Automotive
During the quarter, wholesale volumes at the Ford Automotive segment increased 42,000 units to 1.75 million. Pre-tax profit decreased to $1.4 billion from $2 billion in the year-ago quarter.
In North America, during the quarter, revenues increased $1 billion to $24.1 billion. Wholesale volumes increased 36,000 year over year to 739,000 units. Further, pre-tax profit decreased to $1.6 billion from $1.9 billion in fourth-quarter 2016.
In South America, revenues increased $0.3 billion to $1.7 billion. Wholesale volumes rose 17,000 to 107,000 units. Pre-tax loss amounted to $197 million.
In Europe, revenues increased $0.9 billion to $8.1 billion. Wholesale volumes increased 26,000 units year over year to 416,000 units. The region incurred pre-tax profit of $56 million during the quarter.
In the Middle East & Africa segment, revenues declined $0.1 billion year over year to $0.8 billion. Wholesale volumes plunged 6,000 units to 35,000 units. The region incurred pre-tax loss of $70 million.
In the Asia-Pacific region, revenues increased $0.4 billion to $83.8 billion. Wholesale volumes declined 31,000 to 452,000 units. The Asia-Pacific region generated pre-tax profit of $5 million.
Financial Services
Ford Credit generated pre-tax profit of $610 million, up from $398 million in the prior-year quarter.
Financial Position
Ford had cash and cash equivalents of $9.6 billion as of Dec 301, 2017, up from $8.1 billion as of Dec 31, 2016.
2018 Guidance
The company expects 2018 adjusted EPS in the range of $1.45-$1.70 and an effective tax rate of 15%.
Zacks Rank and Top Picks
Ford carries a Zacks Rank #3 (Hold). You can see the complete list of today’s Zacks #1 Rank (Strong Buy) stocks here.
A few better-ranked automobile stocks in the same space are Daimler AG (NYSE:F) , Allison Transmission Holdings, Inc. (NYSE:ALSN) and Oshkosh Corporation (NYSE:OSK) , each carrying a Zacks Rank #2.
Daimler has a long-term growth rate of 2.8%. The company’s shares have gained 8.3% in the past 12 months.
Allison Transmission has a long-term growth rate of 10%. The company’s shares have gained 23.5% in the past 12 months.
Oshkosh has a long-term growth rate of 14.5%. The company’s shares have gained 24.9 % in the past 12 months.
Ford Motor Company Price, Consensus and EPS Surprise
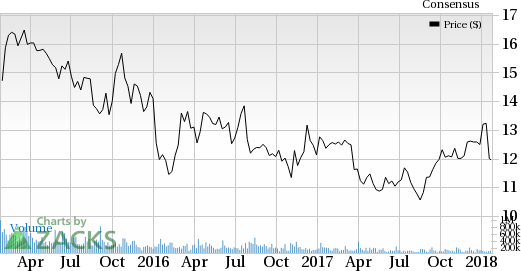
Ford Motor Company Price, Consensus and EPS Surprise | Ford Motor Company Quote
Today's Stocks from Zacks' Hottest Strategies
It's hard to believe, even for us at Zacks. But while the market gained +18.8% from 2016 - Q1 2017, our top stock-picking screens have returned +157.0%, +128.0%, +97.8%, +94.7%, and +90.2% respectively.
And this outperformance has not just been a recent phenomenon. Over the years it has been remarkably consistent. From 2000 - Q1 2017, the composite yearly average gain for these strategies has beaten the market more than 11X over. Maybe even more remarkable is the fact that we're willing to share their latest stocks with you without cost or obligation.
See Them Free>>
Ford Motor Company (F): Free Stock Analysis Report
Daimler AG (DDAIF): Free Stock Analysis Report
Allison Transmission Holdings, Inc. (ALSN): Free Stock Analysis Report
Oshkosh Corporation (OSK): Free Stock Analysis Report
Original post
Zacks Investment Research