As expected, the FOMC at its December meeting raised the target policy range for federal funds to 50–75 basis points. The Committee also released its latest summary of economic projections (SEPs), which shows the expected path for the federal funds rate, consistent with participants’ forecasts for GDP, unemployment, and inflation, and with the Fed’s statutory mandates. Not surprisingly, commentators immediately argued that the Committee’s median policy rate forecast suggested that there would be three rate hikes in 2017. We will show that this reading is probably an overestimate, just as the estimate in December 2015 was for four rate increases in 2016, which did not occur. But first a look at what the FOMC said about the economy.
The FOMC statement made five principal observations. First, labor market had strengthened further, with solid job gains and a decline in the unemployment rate. Second, the economy expanded at a moderate rate since midyear. Third, household spending increased moderately; but, fourth, investment spending was soft. Finally, while inflation increased from earlier this year, it remained below the Committee’s 2% target for the PCE.
In making these assessments, what kinds of evidence might the Committee have considered and what sense of progress can we infer from the Committee’s characterization of household spending and GDP growth as moderate? As noted in a previous commentary, since 2010 and prior to its December statement, the FOMC has characterized real GDP growth as moderate 26 times.
Mean GDP growth for those 26 times was only about 2%, with a standard deviation of 1.12 percentage points. Clearly, the 3.2% GDP growth for Q3 of 2015 was substantially greater than the mean, outside of one standard deviation, and almost 2 percentage points or more above that for each of the previous three quarters.2 Furthermore, household spending in Q3 was actually less than it was in Q2.3 To be sure, investment spending was virtually nonexistent, probably because corporate profits mustered only a meager 1.57% increase after five consecutive quarters of declines that ranged from -2.93 to -6.49 percent.
On the jobs front, the economy added 171K jobs in November, up from 142K in October. But job growth in 2016 averaged only about 180K, down from an average of 229K in 2015. Interestingly, if the economy created jobs at the same rate it did from 1960–1974, the average would be about four times greater, and twice as great if it created jobs at the rate it did from 1983–2006. In other words, while the economy has been creating jobs, performance is clearly subpar compared to historical experience and is testimony to the dismal growth in productivity we have experienced since the financial crisis.
Of great concern to the FOMC is the level of slack in the labor force. While the headline unemployment rate has declined, the U-6, which measures the percentage of people working part-time but who want a full-time job, has remained above historical norms, leading some policy makers to argue that interest rates can remain low until additional improvement materializes. On the other hand, the number of job vacancies has climbed to over 5 million, which leads many to conclude that labor markets are essentially at full employment and that skill mismatches help to explain the difficulties that employers are experiencing finding qualified workers.
The real puzzle for policy makers, however, is the failure of inflation to pick up, given the extreme policy accommodation in place and the large amount of excess reserves now on the Fed’s balance sheet from its asset purchase programs. The last three months have seen a rise in inflation from 0.87 percent in August to 1.4% in October. But this inflation rate is still 60 basis points below the FOMC’s PCE 2% target.
There are at least three plausible explanations for the failure of inflation to pick up. The first is simply lack of demand. The NFIB survey of small business, for example, suggests that access to credit is not a significant problem. The second is that many companies – especially large companies – have large cash reserves and don’t need to borrow. The third is that a large portion of the excess reserves – 40 percent – are on the books of foreign banks that aren’t major suppliers of credit to US businesses. Furthermore, given negative rates in Europe and Japan, for example, the positive yields on bank reserves offer an attractive riskless return; and these reserve holdings also count towards the Basel III bank liquidity coverage ratio.
As part of the report on the FOMC’s December meeting, the Committee released its projections on where it sees year-end 2016–2019 values for GDP growth, unemployment, and inflation, together with the distribution of participants’ assumed federal funds rates consistent with the projected outcomes.
Three key observations jump out from these data. First, the Committee has continually overshot GDP growth and inflation and undershot unemployment. Second, GDP growth throughout the entire forecast horizon is viewed as being substantially below historical trends, hovering around 2% and within a narrow range of plus or minus 0.2–0.3 percentage points. This evidence suggests that low productivity and slow growth in the labor force will combine to put the economy on only a modest growth trajectory for the foreseeable future, and it implies a relatively low real rate of interest – in the neighborhood of 2%. Finally, despite what is seen to be a relatively tight labor market, with the unemployment rate hovering around 4.4 to 4.7 percent through 2019, inflation is seen as being below target throughout. This suggests that there is little need for the FOMC to rush to raise interest rates.
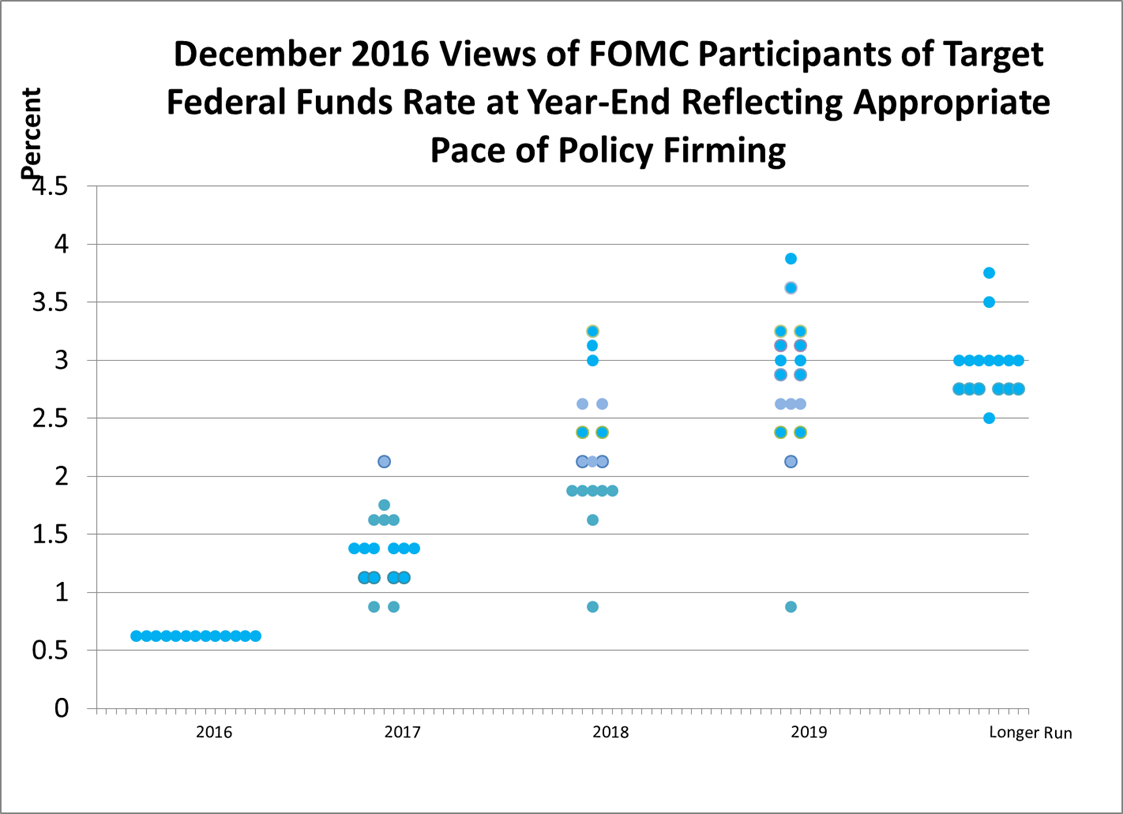
As for the rate assumptions behind these projections, the Committee has again offered the so-called dot chart, shown below, that details each participant’s assumed federal funds rate at the end of each year. Much has been made of the fact that the median funds rate suggests the committee sees three rate hikes in 2017 and that the projected path going forward was revised up from September.
Indeed, the Friday after the FOMC meeting, President Lacker even suggested that four rate hikes might be appropriate in 2017. However, market commentators tend to ignore the reality that all the participants behind the dots are not equal. What matters is not the median or the range but who the voters are on the FOMC and what their views are. From the above chart, we see that six participants see one or at most two rate hikes in 2017. The question is who those six dots might represent, since it only takes six votes from the ten voting members of the FOMC – five members of the Federal Reserve Board (there are two vacancies) and five Federal Reserve Bank presidents – to determine the federal funds rate target range. That is, only one bank president and the five governors can determine policy. Of the five governors, at most one may have suggested three rate hikes in 2017, but we also know that not one governor has failed to vote in favor of the policy rate decision made by the Committee since the financial crisis. We know that President Bullard, because of his assumption that we are presently in a low-rate regime, is likely projecting only one hike in 2017, and Governor Brainard has been a strong supporter of a slow path as well. We also know that, of the voting bank presidents next year, President Dudley has consistently voted to keep rates low; and President Evens, who also votes next year, has favored low rates since the crisis. The point here is that the voting members of the FOMC are clustered below the median when it comes to their assumed path next year for the federals funds rate, and it is unlikely that a one governor would abandon the consensus view of his or her colleagues.
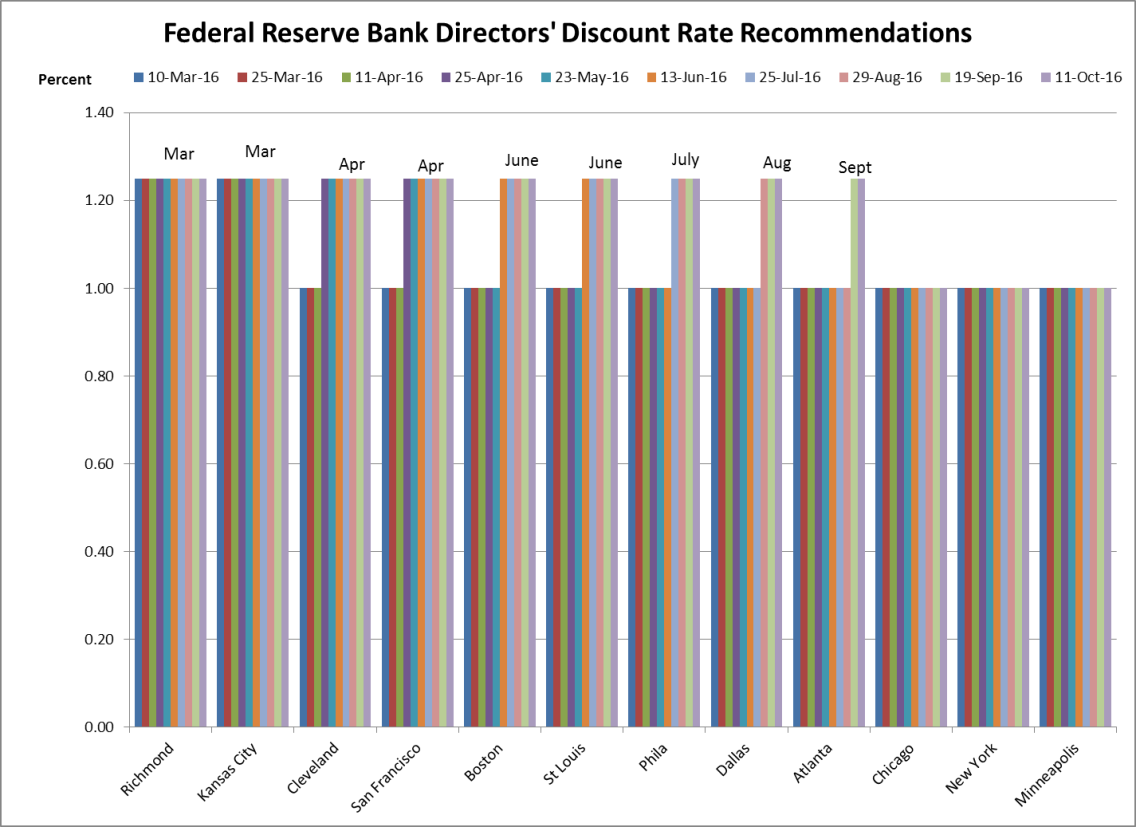
So is there any other way to glean how the voting presidents might be leaning? One clue can be found in the pattern of the 12 Federal Reserve Bank Boards of Directors’ recommendations on the discount rate, which are submitted on a staggered basis to the Board of Governors every two weeks. While discount rate recommendations are the purview of each bank’s board of directors, these recommendations are heavily influenced by the respective bank’s president. And while each president’s position at FOMC meetings is not necessarily that of the bank’s board of directors, there is a close relationship between the discount rate recommendations, the president’s views, and the position he or she takes at the FOMC. The following chart shows the pattern of reserve bank discount recommendations up until this last meeting.
Note that Chicago (Evans), New York (Dudley), and Minneapolis (Kashkari) have consistently recommended no change in the discount rate during 2016, whereas Richmond and Kansas City have consistently recommended an increase. This pattern of discount rate recommendations largely mirrors the public stances these banks’ presidents have taken individually on monetary policy, including their dissents and votes at the FOMC. Keep in mind the point made earlier that it is likely that President Evans, when he votes next year, will be on the more cautious side when it comes to the preferred path for rate hikes in 2017.
This analysis brings us back to the key point made at the beginning of this analysis. The conclusion is that the probabilities favor only two rate hikes in 2017 rather than the three hikes widely discussed in the financial media. Moreover, a cautious approach also seems more likely because of the uncertainty about the Trump administration’s policy initiatives. Chair Yellen made it clear at her post meeting press conference that unlike markets, which have started to price in an economic stimulus, the SEP forecasts largely did not. As the year and administration policies evolve, these conclusions may change. But right now, it seems likely that rates will remain low, the yield curve will flatten, and funds will continue to flow into the US because of the arbitrage incentives provided by negative interest rate policies in the rest of the world.
