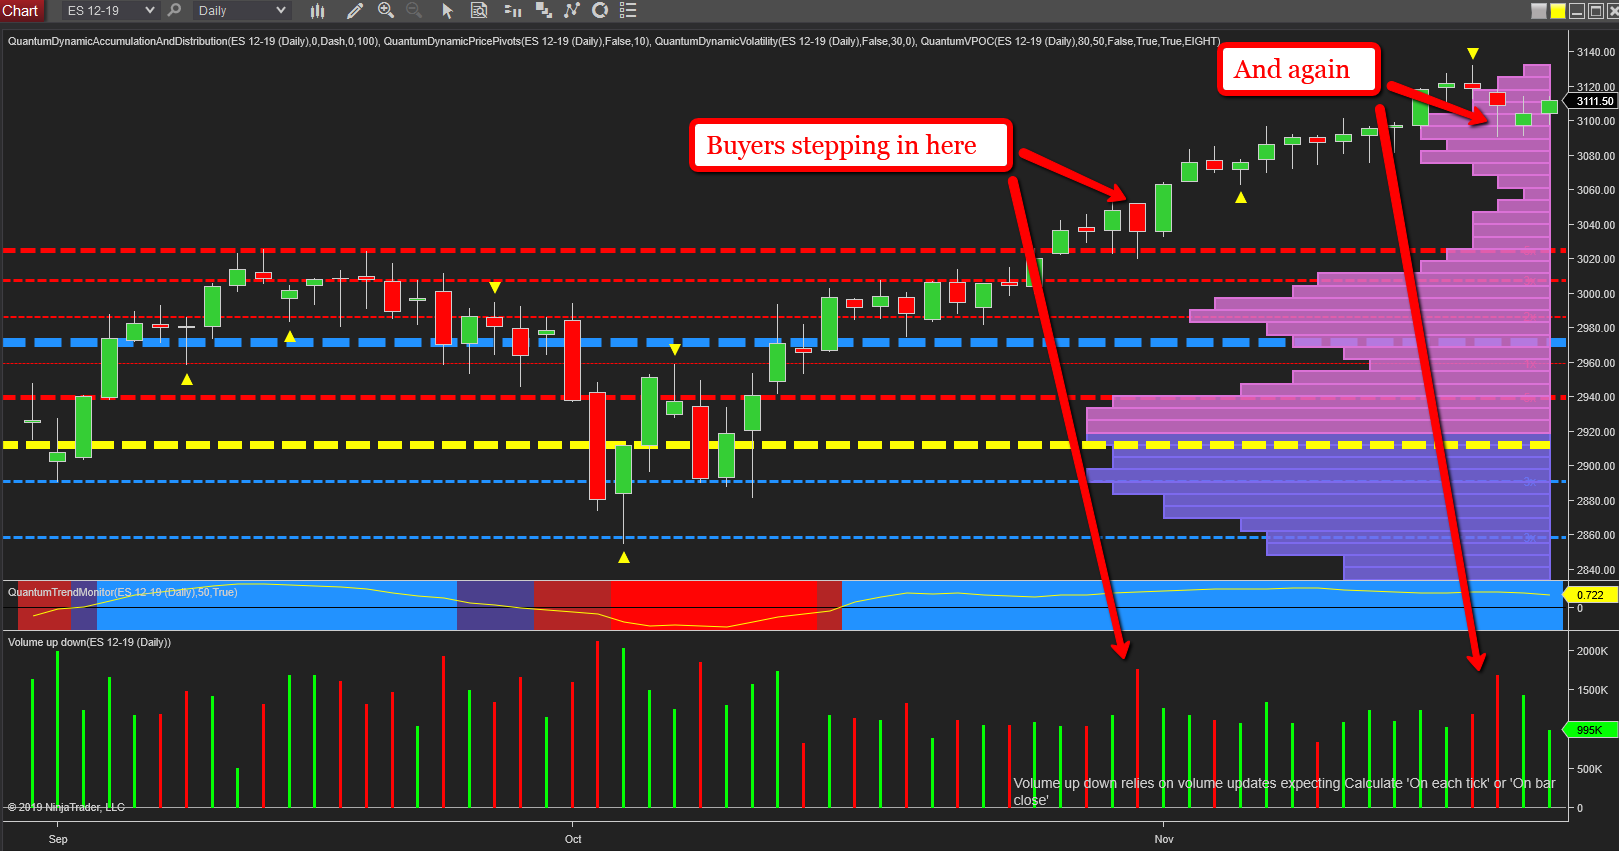
When markets are in a strong uptrend, we always consider every candle and its relationship to volume, but it is often the down candles which reveal more about whether a trend is either reaching an exhaustion point or is preparing for a further run higher. And this is certainly the case for the US indices at present where progress is constantly hindered by comment and reaction to the ongoing Chinese and US tariff debate and which shows no signs of abating.
On Wednesday last week, the markets reacted once again to such news, selling off sharply only to recover late in the session and as a consequence posting a down candle with a deep lower wick. But note the volume associated with this move on the daily chart for the ES E-mini – it is extremely high and therefore indicative of strong buying which duly drove the market off the lows of the session to close back near the open. This strong signal suggests the move is not over and there is further upside momentum to come, and in October we had another such example, again on high volume which was followed by a continuation of the bullish trend.
These are clear single examples that catch the eye, but there are also many other less obvious signals in any move higher, and not least whether the candles are showing more wicks to the upside than the downside. If it is the former, then the market is likely to weaken. If it is the latter, then the buyers remain in control and bullish sentiment is set to continue a fact confirmed by the trend monitor indicator at the bottom of the chart.
