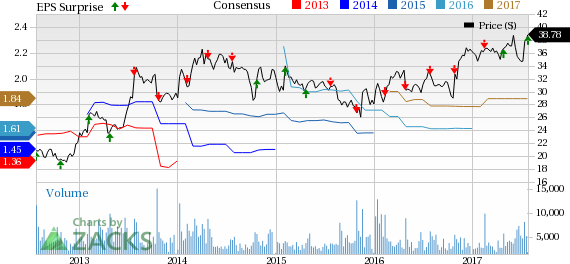
FLIR Systems Inc.’s (NASDAQ:FLIR) second-quarter 2017 adjusted earnings per share came in at 42 cents, surpassing the Zacks Consensus Estimate by a penny. The figure rose 13.5% over the prior-year quarter number on solid top-line growth.
GAAP net earnings for the quarter came in at $51.4 million, higher than the year-ago quarter’s figure of $45.4 million.
Inside the Headlines
The company’s top line grew 7.8% year over year to $434.1 million. However, revenues missed the Zacks Consensus Estimate of $437 million. Phenomenal rise in the company’s OEM & Emerging Markets segment drove the overall top line. Also, sturdy performances of Surveillance and Instruments segments boosted the sales performance.
As for the segments, OEM & Emerging Markets revenues continued their striking growth trajectory, rising an impressive 54.0% over the prior-year quarter to $87.4 million. The segment’s revenues were partially driven by the addition of the Integrated Imaging Solutions line of business from the recent acquisition of Point Grey Research. Surveillance segment revenues also rose 14.0% year over year to $129.2 million. Revenues from the Instruments segment came in at $86.0 million, up 10% on a year-over-year basis.
The Security segment’s revenues were down 22% to $49.7 million from the prior year, mainly attributable to a decline in Lorex-branded products. Also, Detection segment revenues shrunk 25% to $26.7 million, largely attributable to unfavorable timing of DR-SKO program shipments. Maritime segment revenues were flat year over year, totaling to $55.1 million.
FLIR Systems' backlog of firm orders for delivery within the next 12 months came in at $645 million, reflecting an increase of 6% from the year-ago quarter figure .
Adjusted operating income came in at $81.0 million compared with $70.1 million in the prior-year quarter. Sturdy top-line growth drove the rise in income.
Liquidity & Cash Flow
As of Jun 30, 2017, the company's cash and cash equivalents were $403.6 million compared with $361.3 million as of Dec 31, 2016. Long-term debt fell to $491.3 million compared with $501.9 million as at Dec 31, 2016.
Cash flow generated from operating activities in the quarter came in at $51.4 million, higher than $45.4 million generated in the year-earlier quarter.
Dividend & Share Repurchase
Concurrent with the earnings report, FLIR Systems announced a quarterly cash dividend of 15 cents per share, payable on Sep 8, 2017, to shareholders of record as of Aug 25.
Guidance
FLIR Systems reiterated its outlook for 2017 and continues to expect adjusted earnings to lie in the range of $1.81–$1.91 per share, on revenues of $1.78–$1.83 billion. The figures represent year-over-year growth of about 7–13% in adjusted earnings and 7–10% growth in revenues.
In fact, the company expects to see an uptick in organic growth second quarter onwards.
Our Take
FLIR Systems’ diverse portfolio has been a staple growth driver, helping it offset weaknesses associated with any one market. The company’s restructuring efforts over the past five years have allowed it to streamline business operations and optimize growth. Key metrics like revenues, operating income, operating margin and adjusted EPS continue to benefit from such actions.
FLIR Systems is enjoying strong top-line growth, as robust momentum in its commercial products and positive performance of most of its segments drive growth. Going forward, the company believes that its strong pipeline of products and steady market traction of the recently launched products will continue to drive revenue sales. Also, the Zacks Rank #3 (Hold) company’s backlog improvement signals decent growth in the second half of the year.
Stocks to Consider
Some better-ranked stocks in the industry are Huntington Ingalls Industries, Inc. (NYSE:HII) , TransDigm Group Incorporated (NYSE:TDG) and L3 Technologies, Inc. (NYSE:LLL) . Each stock carries a Zacks Rank #2 (Buy). You can see the complete list of today’s Zacks #1 Rank (Strong Buy) stocks here.
Huntington Ingalls has an average positive surprise of 3.0% over the trailing four quarters, beating estimates twice for as many misses.
TransDigm delivered an average positive earnings surprise of 3.7% for the trailing four quarters, beating estimates each time.
With four back-to-back beats over the trailing quarters, L3 Technologies has an average positive surprise of 10.46%.
The Hottest Tech Mega-Trend of All
Last year, it generated $8 billion in global revenues. By 2020, it's predicted to blast through the roof to $47 billion. Famed investor Mark Cuban says it will produce ""the world's first trillionaires,"" but that should still leave plenty of money for regular investors who make the right trades early.
See Zacks' 3 Best Stocks to Play This Trend >>
Huntington Ingalls Industries, Inc. (HII): Free Stock Analysis Report
Transdigm Group Incorporated (TDG): Free Stock Analysis Report
FLIR Systems, Inc. (FLIR): Free Stock Analysis Report
L-3 Communications Holdings, Inc. (LLL): Free Stock Analysis Report
Original post
Zacks Investment Research

