Investing.com’s stocks of the week
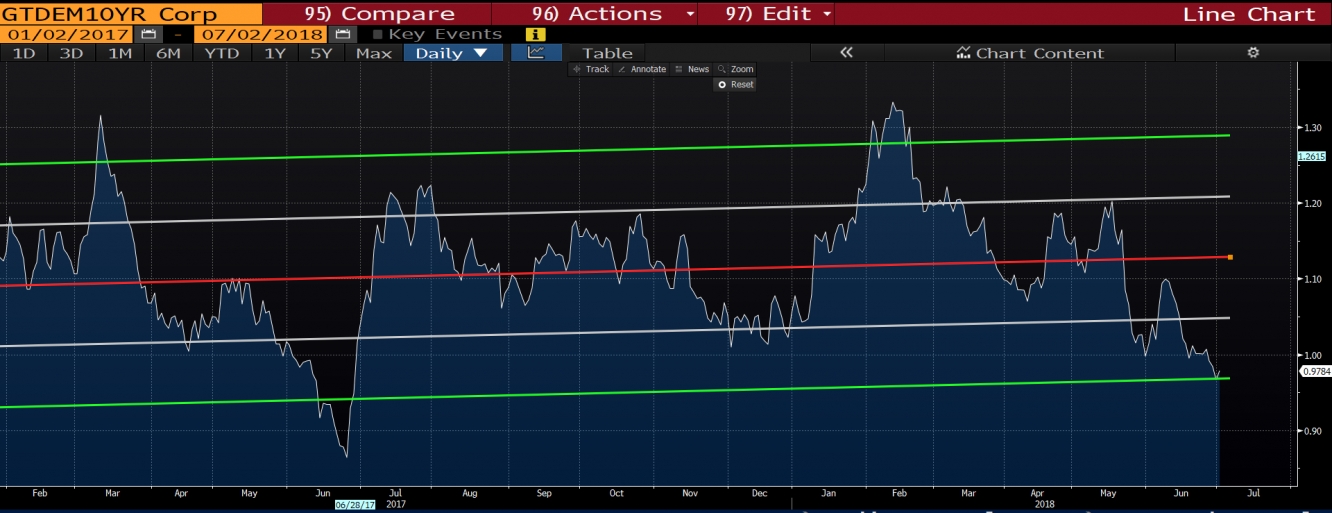
Recently the ECB announced that they consider buying more long-term bonds from next year as part of the QE reinvestment. This will more likely end-up with bullish flattening in the 10-30 year zone. The spread currently is at around 70 bps with lowest and highest levels for this year being at 60 bps and 78 bps respectively. Having this in mind let’s take a look at 2-10 year spread.
Source: Bloomberg
The spread has reached the level of two standard deviations below the regression line for the period of January 2017 and July 2018. During the last ECB meeting it was mentioned that rate hikes might begin next year after summer. According to Eonia pricing, market expects 10 bps hike after 11 ECB meetings. Therefore seems bearish flattening of the 2-10 year curve is postponed for now and with raising inflation in the Eurozone (latest data indicates 2% YOY) one can conclude that 2-10 year spread will not go below the current level. However if we combine expectations for the next year, with no further generated inflation, reinvestments and hikes, we might have bullish flattening in the 10-30 year and bearish flattening in the 2-10 year zone, as a result flattening of the 2-30 curve.
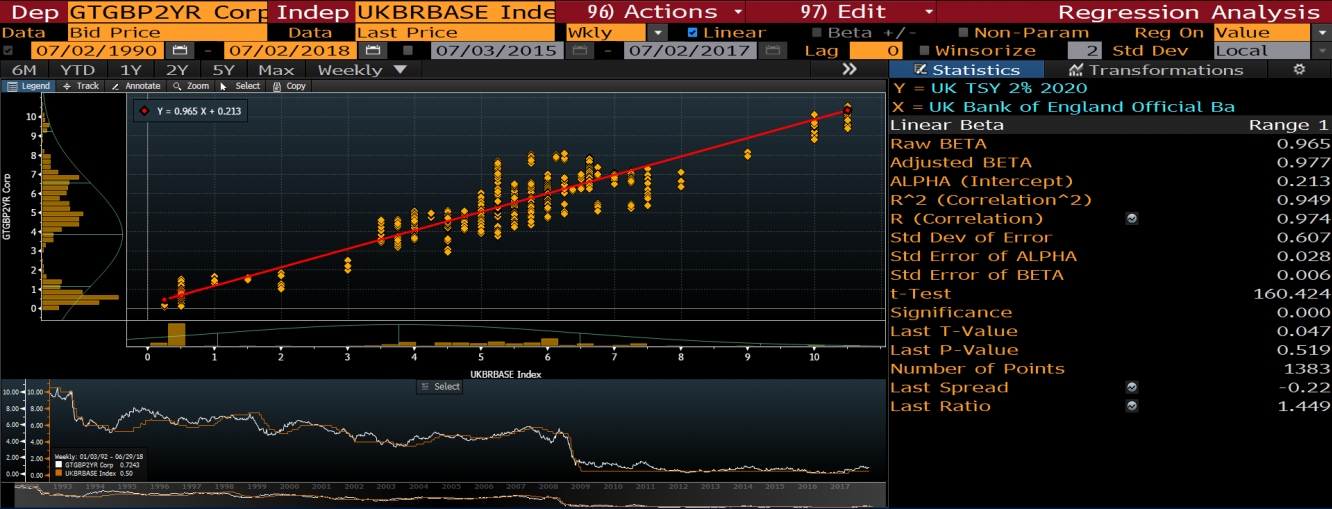
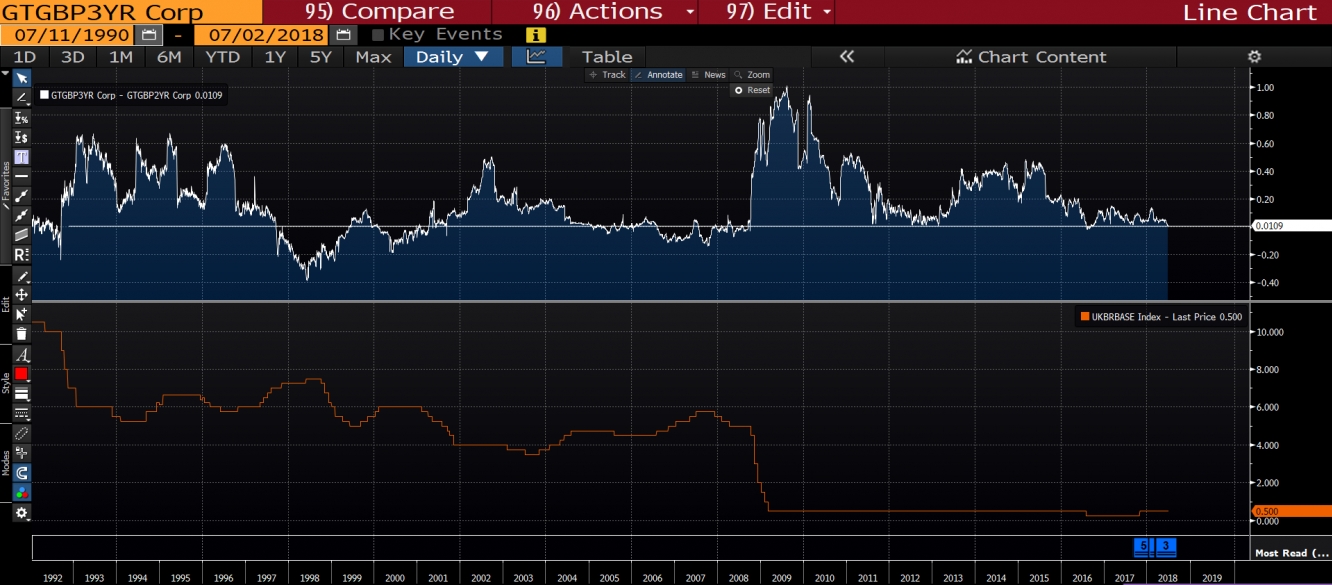
In case of the UK treasuries I am more curious about the future pattern of the 2-3 year treasuries spread. Currently the spread is around 1 bps. Last time spread went below the level of zero after the divorce vote. Below is given the correlation between two year treasury with the bank rate.
Source: Bloomberg
I used weekly data from 1990 to 2018. The correlation coefficient is 0.974. The regression equation is Y = 0.965 * X + 0.504.
The spread has reached the level of two standard deviations below the regression line for the period of January 2017 and July 2018. During the last ECB meeting it was mentioned that rate hikes might begin next year after summer. According to Eonia pricing, market expects 10 bps hike after 11 ECB meetings. Therefore seems bearish flattening of the 2-10 year curve is postponed for now and with raising inflation in the Eurozone (latest data indicates 2% YOY) one can conclude that 2-10 year spread will not go below the current level. However if we combine expectations for the next year, with no further generated inflation, reinvestments and hikes, we might have bullish flattening in the 10-30 year and bearish flattening in the 2-10 year zone, as a result flattening of the 2-30 curve.
In case of the UK treasuries I am more curious about the future pattern of the 2-3 year treasuries spread. Currently the spread is around 1 bps. Last time spread went below the level of zero after the divorce vote. Below is given the correlation between two year treasury with the bank rate.
Source: Bloomberg
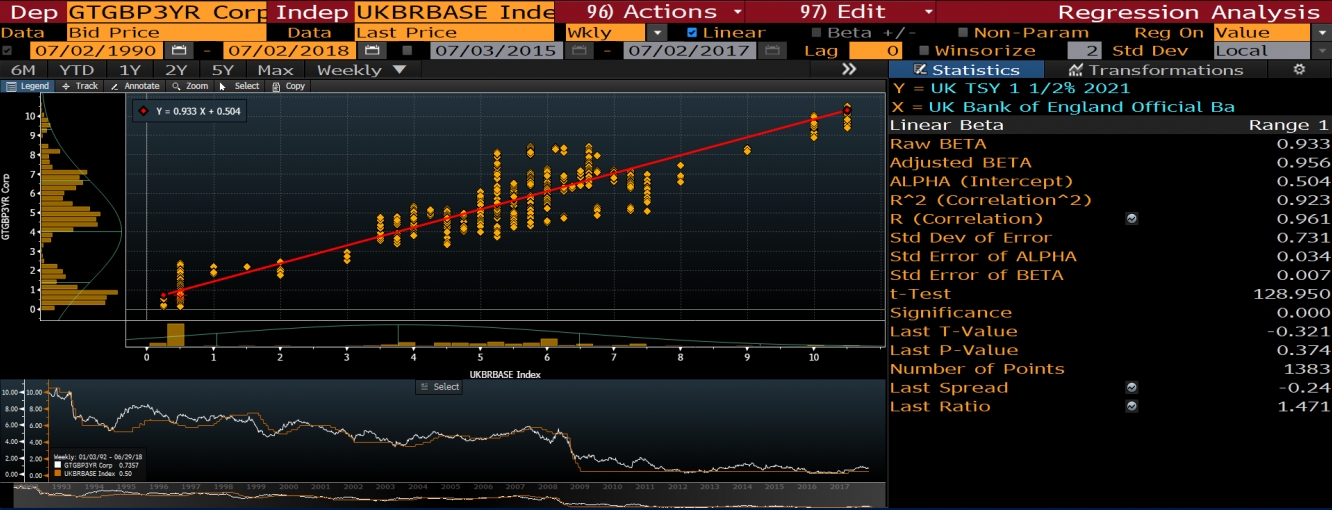
Same data range is used. The correlation coefficient is 0.961 and the regression equation is Y = 0.933 * X + 0.213. So now the most interesting part. If we look at how historically spread changed during easing and tightening cycles we can see that during tightening the spread decreases and during easing the spread increases. One more important thing is the next hike expectation. Hike probability in August is 67%. There is still a room for the further increase of the probability, so let’s consider that the probability will rise and do some basic manipulations with the regression equations and calculate the effect of the 25 bps hike. The purpose is to calculate the effect of the hike on treasuries. If we deduct 0.965 * X + 0.213, from the 0.965 * (X+0.25) + 0.213 which is the yield of 2 year treasury after the hike, we have 0.965 * 0.25 = 0.24. We do the same calculation for the 3 year paper and have 0.933 * 0.25 = 0.23. So roughly saying in case of the next hike we might have 1 bps decrease in the spread. As it was mentioned above the current spread is also 1 bps, therefore hikes might drive the spread closer to the negative territory, causing further flattening.
Source: Bloomberg
The last part will be about the US 2-5 year spread. Below are given two charts that illustrate several relationships.
Source: Bloomberg
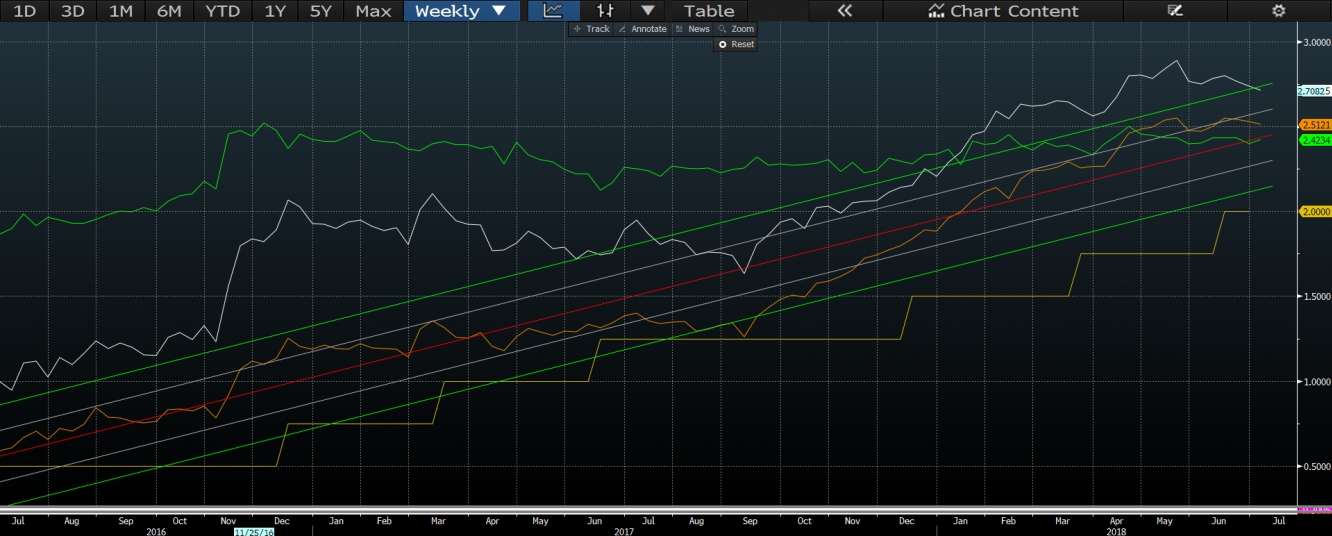
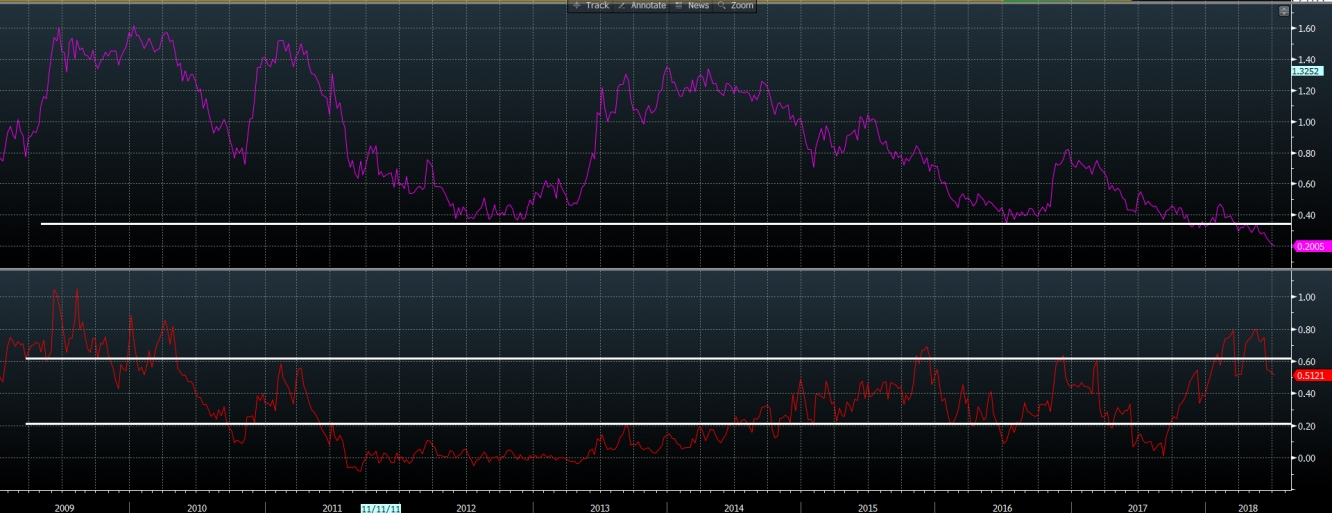
On the chart above I have fed funds rate, 2 year treasury rate (brown), 5 year treasury rate (white) and inflation swap forward rate (green). We can see that 2 year treasury yield moves within the regression channel. 5 year treasury moved above inflation swap forward rate at the beginning of this year, last time same happened in 2008. At the same time 2 year treasury moved from the below regression line level to above regression line due to the aggressive hikes pricing. So what about the spreads? On the upper part of the chart given below I have spread between 2 and 5 year treasuries. As it can be observed there is one more flattening, spread moved below long time lows. On the bottom part of the chart I have spread between 2 year treasury and fed fund rate. For the period started in 2015, it usually moves between 60 and 40, however during the last two hikes it did move above 60 (good indicator to take a position). At the moment one can expect it to move lower to the level of 20 until the next hike, so there will be a room before next mini cycle of flattening starts due to the rate hike.
Source: Bloomberg

