Fitbit, Inc. (NYSE:FIT) reported second-quarter 2017 adjusted loss (excluding all one-time items but including stock-based compensation) of 18 cents per share, which was narrower than the Zacks Consensus Estimate of a loss of 22 cents per share. The top line was also better than our expectation.
At the call, management appeared satisfied with the pace of execution of its transition plan. In the quarter, Fitbit sold 3.4 million devices, up 14% sequentially but down 40% year over year. Repeat purchases contributed 36% to activations. New products launched in the last 12 months - Charge 2, Alta HR, and Flex 2 - contributed 81% of revenues.
The stock was up 4.3% in afterhours trading in response to the better-than-expected results. We, however, note that Fitbit’s growth has been hampered by smartwatches outshining the fitness wearable category, influx of new wearables, lack of upgrades among existing users and lackluster growth in the Asia Pacific region.
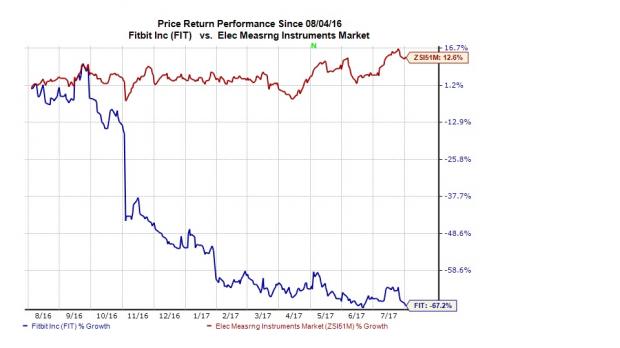
The impact of these headwinds has been significant on the stock, which significantly underperformed the industry over the last one year. While the industry has gained 12.6%, the stock lost a massive 67.1%.

Let’s check out the numbers in detail.
Revenues
Fitbit reported revenues of $353.3 million, which were up 18.2% year over year but down 39.8% on a sequential basis. The top line exceeded the guidance of $330 million to $350 million and the consensus mark of $339 million.
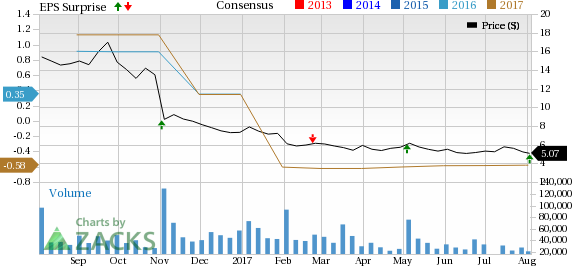
Fitbit, Inc. Price, Consensus and EPS Surprise
The year-over-year top line growth was driven by strong demand for connected health and fitness trackers and special edition devices. Fitbit Charge 2 remains the top selling connected health and fitness tracker in the U.S. Continued strength of the company’s Blaze offering also drove the results. Enterprise customers voted Fitbit Blaze as the number one tracker.
Geographically, revenues from the United States accounted for 56% of the second quarter revenues; EMEA brought in 31%, Americas excluding the U.S contributed 7% and the remaining 6% came from Asia Pacific.
Second-quarter revenues from the EMEA jumped 12.2%. Asia-Pacific revenues recorded an increase of 11.9%. In the U.S. and the Americas excluding the U.S., revenues decreased 55.3% and 12.7% year over year, respectively.
Margins and Net Income
Gross profit for the second quarter was $150.6 million. Gross margin was 42.6%, up 259 basis points (bps) sequentially and 77 bps year over year.
Gross margin was negatively impacted by a change in mix and excess component materials and manufacturing capacity.
Pro-forma net loss was $41.3 million or loss per share of 18 cents compared with loss of $56.2 million or loss per share of 25 cents in the previous quarter. In the year-ago period, the company had recorded income of almost $15 million or earnings of 7 cents a share.
Balance Sheet and Cash Flow
As of Jul 1, 2017, cash and cash equivalents was $318.7 million compared with $374.3 as of Apr 1.
Accounts receivables were $216.3 million compared with $194.8 million in the previous quarter. Inventories were $141.5 million compared with $200.3 million in the previous quarter.
Guidance
For the third quarter of 2017, Fitbit expects revenues to remain in the range of $380 million to $400 million. The midpoint of the range is higher that than the Zacks Consensus Estimate of $386.6 million. The company expects non-GAAP loss per share to be in the range of 2 cents to 5 cents. The Zacks Consensus Estimate is pegged at a loss of 10 cents per share. It expects non-GAAP tax rate to be approximately 46%.
Zacks Rank and Stocks to Consider
Fitbit currently has a Zacks Rank #3 (Hold). Better-ranked stocks in the broader business sector include Alibaba (NYSE:BABA) , Lam Research Corporation (NASDAQ:LRCX) and MaxLinear (NYSE:MXL) , each sporting a Zacks Rank #1 (Strong Buy). You can see the complete list of today’s Zacks #1 Rank stocks here.
Long-term expected earnings per share growth rate for Alibaba, Lam Research and MaxLinear is projected to be 29%, 17.2% and 17.5%, respectively.
More Stock News: Tech Opportunity Worth $386 Billion in 2017
From driverless cars to artificial intelligence, we've seen an unsurpassed growth of high-tech products in recent months. Yesterday's science-fiction is becoming today's reality. Despite all the innovation, there is a single component no tech company can survive without. Demand for this critical device will reach $387 billion this year alone, and it's likely to grow even faster in the future.
Zacks has released a brand-new Special Report to help you take advantage of this exciting investment opportunity. Most importantly, it reveals 4 stocks with massive profit potential. See these stocks now>>
Alibaba Group Holding Limited (BABA): Free Stock Analysis Report
Fitbit, Inc. (FIT): Free Stock Analysis Report
MaxLinear, Inc (MXL): Free Stock Analysis Report
Lam Research Corporation (LRCX): Free Stock Analysis Report
Original post
Zacks Investment Research

