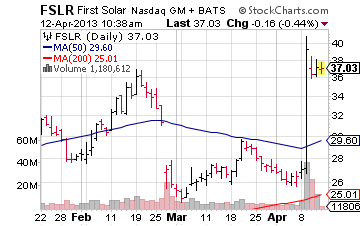
First Solar (FSLR) stock triggered a solar flare last week on the Nasdaq as circuit breakers were triggered on Tuesday, April 9.
The event was caused by a massive amount of short-covering in First Solar stock after the company issued impressive 2013 guidance, with full-year earnings expected between $4.00 and $4.50 a share on sales of between $3.8 billion and $4 billion. Analysts had been expecting to see earnings guidance of $3.51 a share in 2013 on sales of approximately $3.1 billion. Trading in First Solar stock was halted on the Nasdaq exchange during Tuesday’s session, in accordance with the guidelines on triggered circuit breakers.
Previous to last week’s solar flare, the sector has suffered through some awful growing pains. The financial crisis resulted in reduced subsidies for development in the rapidly-advancing photovoltaic power industry. Meanwhile, China increased government financing of its solar industry, having already established a strong presence in the sector with such companies as Suntech Power (STP) and LDK Solar (LDK).
With its ramped-up, less expensive production capabilities, China began “dumping” its lower-priced solar panels in foreign markets – especially the United States – putting many of the American competitors (such as Solyndra) out of business. Eventually the entire solar industry went into a slump. Chinese companies – such as Suntech Power, which was trading in excess of $40 per share in 2009 – saw their share prices sink even deeper than those of their American competitors. Things became so bad for Suntech that even with a 17-percent share price surge on April 11, the stock closed at a paltry 87 cents per share.
But that was then and this is now.
On April 9th, Arizona-based First Solar announced the development of new technology that improves the efficiency rate of its solar panels. The panels it manufactured last year could convert 13 percent of the sunlight into electricity. The new panels have improved the efficiency rate to just above 16 percent. First Solar also announced that it had purchased a startup called TetraSun, which was in the process of developing technology to improve solar panel efficiency rate to 21 percent. The news sent First Solar stock skyrocketing from $27.14 at the opening bell to $39.95 at the close.
This week’s action in the solar sector is a continuation of action that began around the beginning of the year. For instance, California-based Sun Power (SPWR) has seen its share price skyrocket by over 96 percent since the start of 2013. At the close of trading on April 11, SPWR had advanced 2.50 percent on the day, compared with the 2.41 percent gain by First Solar (Nasdaq:FSLR). Another American solar heavyweight is MEMC Electronic Materials (WFR) which has enjoyed an 18 percent increase in its share price during the past week.
For investors wanting to join in the solar heat via exchange traded funds, there are presently two ETFs focused exclusively on the solar sector:
Market Vectors Solar Energy ETF (KWT) has a market cap of only $12 million, which is invested in a portfolio of 34 stocks related to the solar industry. The top holding is First Solar (and it accounts for 9.34 percent of the weight. The major drawback to this ETF is that it is thinly-traded, averaging about 8,000 shares per day during the past three months.
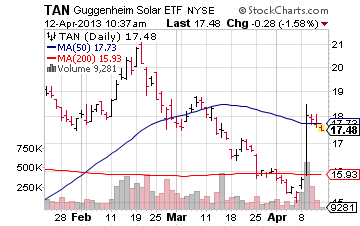
The Guggenheim Solar ETF (TAN) has a market cap of $64 million, which is invested in 22 securities from the solar sector. Its top holding is also First Solar (FSLR) and it accounts for 14 percent of the weight. Its average trading volume over the past three months has been a healthy 147,000 shares.
Another ETF which invests in the solar sector is the PowerShares WilderHill Clean Energy ETF (PBW). Although its holdings are not limited to the solar sector, its most significant holding is SunPower Corporation (SPWR) at 4.96 percent of the weight. Its number three holding is MEMC Electronic Materials (WFR) at 3.42 percent of the weight. PBW’s average trading volume is robust at over 400,000 shares per day. Its market cap is $135 million.
Bottom line: The solar sector finally appears to be emerging from its own Dark Age. With the Obama Administration solidly supporting alternative energy and with new technologies on the horizon, alternative energy and solar ETFs could offer significant growth potential for making hay while the sun is shining.
Disclaimer: The content included herein is for educational and informational purposes only, and readers agree to Wall Street Sector Selector’s Disclaimer, Terms of Service, and Privacy Policy before accessing or using this or any other publication by Wall Street Sector Selector or Ridgeline Media Group, LLC.
- English (UK)
- English (India)
- English (Canada)
- English (Australia)
- English (South Africa)
- English (Philippines)
- English (Nigeria)
- Deutsch
- Español (España)
- Español (México)
- Français
- Italiano
- Nederlands
- Português (Portugal)
- Polski
- Português (Brasil)
- Русский
- Türkçe
- العربية
- Ελληνικά
- Svenska
- Suomi
- עברית
- 日本語
- 한국어
- 简体中文
- 繁體中文
- Bahasa Indonesia
- Bahasa Melayu
- ไทย
- Tiếng Việt
- हिंदी
First Solar Stock And Solar ETFs Are Hot
Published 04/15/2013, 01:34 AM
Updated 05/14/2017, 06:45 AM
First Solar Stock And Solar ETFs Are Hot
First Solar stock and solar ETFs are hot and here’s how you can participate
Latest comments
Loading next article…
Install Our App
Risk Disclosure: Trading in financial instruments and/or cryptocurrencies involves high risks including the risk of losing some, or all, of your investment amount, and may not be suitable for all investors. Prices of cryptocurrencies are extremely volatile and may be affected by external factors such as financial, regulatory or political events. Trading on margin increases the financial risks.
Before deciding to trade in financial instrument or cryptocurrencies you should be fully informed of the risks and costs associated with trading the financial markets, carefully consider your investment objectives, level of experience, and risk appetite, and seek professional advice where needed.
Fusion Media would like to remind you that the data contained in this website is not necessarily real-time nor accurate. The data and prices on the website are not necessarily provided by any market or exchange, but may be provided by market makers, and so prices may not be accurate and may differ from the actual price at any given market, meaning prices are indicative and not appropriate for trading purposes. Fusion Media and any provider of the data contained in this website will not accept liability for any loss or damage as a result of your trading, or your reliance on the information contained within this website.
It is prohibited to use, store, reproduce, display, modify, transmit or distribute the data contained in this website without the explicit prior written permission of Fusion Media and/or the data provider. All intellectual property rights are reserved by the providers and/or the exchange providing the data contained in this website.
Fusion Media may be compensated by the advertisers that appear on the website, based on your interaction with the advertisements or advertisers.
© 2007-2025 - Fusion Media Limited. All Rights Reserved.
