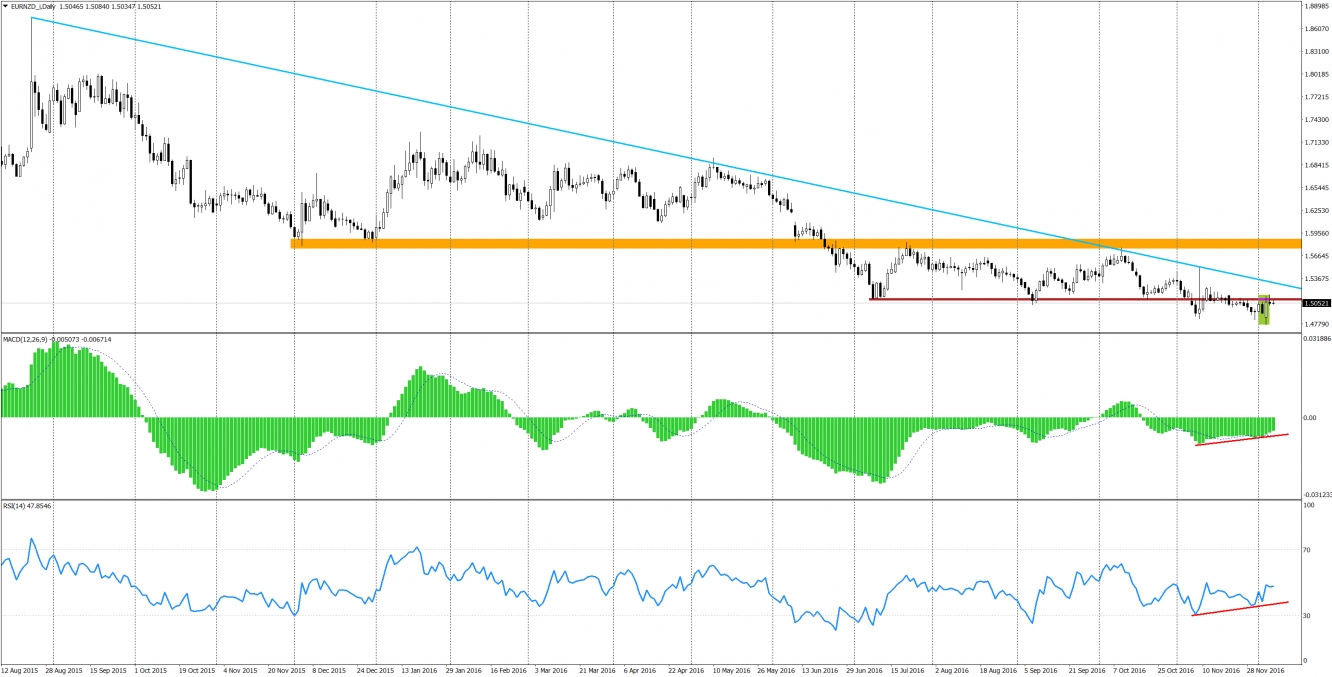
It is too early now to say that reversal is coming for sure but better be aware of such a possibility as soon as possible. What signals can we see to support this view? First of all, look at the candlestick pattern highlighted with the green colour. This is the bullish engulfing, usually a strong bullish pattern. What is more, it creates a double bottom formation (9.11 and 5.12), with divergences given by both: MACD and RSI. If such a positive setup is present, what stops us from going 'all aboard' ? The answer is that signal is not complete. For the double bottom formation to be a buy signal we need to see the breakout of the red horizontal resistance and additionally a blue bearish trendline. I do know that when waiting, you miss 200 pips but you increase the odds of a success. This is needed, especially when you go against the trend, which is always more risky.
Keep in mind the ECB rate decision on Thursday. Actually this can be the driver that can help the buyers to break those resistances mentioned above. With this kind of an event in calendar, maybe it would be wise to consider a pending order, which would be activated in case of a bullish breakout. Regardless of the approach that will be chosen here, bullish engulfing mentioned above, defines the stop loss order, which from the price action point of view should be based below the lowest price of this formation.

