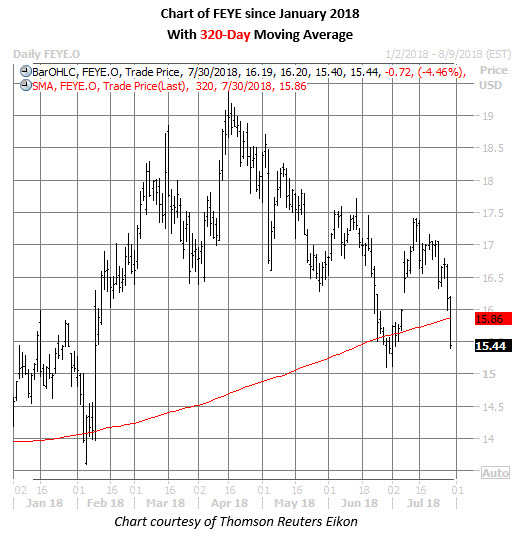
FireEye Inc (NASDAQ:FEYE) is scheduled to report second-quarter earnings after the market closes this Wednesday, Aug. 1. Ahead of the earnings, the cybersecurity stock is trading down 4.5% at $15.44, but holding above key technical support. Nevertheless, put buyers are making a rare appearance, betting on bigger losses through week's end.
At last check, around 3,500 calls and 1,750 puts had changed hands on FEYE -- 1.6 times what's typically seen. The January 2019 21-strike call is most active, while pre-earnings options traders are targeting the weekly 8/3 17-strike put. It looks as if new positions are possibly being purchased at the weekly put option, suggesting speculators expect the stock to sink further below $17 by expiration at this Friday's close.
Widening the scope shows short-term options traders are more call-skewed than usual toward FireEye. The stock's Schaeffer's put/call open interest ratio (SOIR) of 0.33 ranks in the 4th annual percentile. Most of this is due to heavy open interest of 14,856 contracts at the back-month September 20 call, which Trade-Alert indicates were mostly bought to open back in March.
Sentiment is more mixed outside of the options pits. Short interest edged higher in the most recent reporting period to 16.40 million shares. This accounts for a healthy 9% of FEYE's available float, or 6.6 times the average daily pace of trading.
Meanwhile, 11 analysts maintain a "buy" or better rating on the equity, while 10 others have placed a lukewarm "hold" rating on FEYE stock. The average 12-month price target, on the other hand, is $19.23 -- a 24.7% premium to current trading levels.
Over the past eight quarters, FireEye shares have closed higher in the session subsequent to earnings four times, lower three times, and flat once. The stock has averaged a single-session post-earnings swing of 8.8%, regardless of direction, with the options market pricing in a more volatile next-day move of 16.1% this time around.
Looking at the charts, FEYE has had a rough stretch since topping out at a two-year high of $19.36 in mid-April. However, the shares appear to have found a foothold atop a trendline connecting higher lows since February -- which roughly coincides with the security's 320-day moving average.

