Investing.com’s stocks of the week
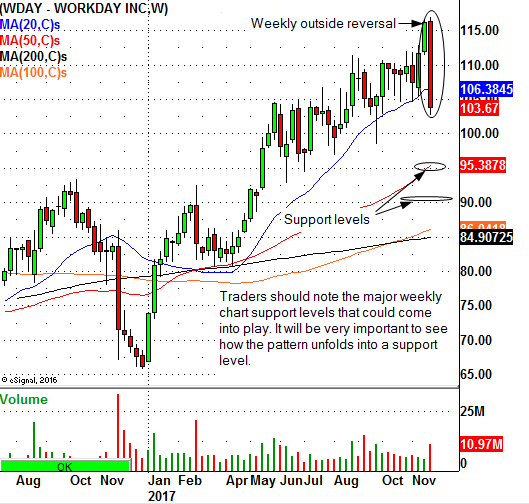
Workday (NASDAQ:WDAY) provides of enterprise cloud applications for finance and human resources. On November 27 the stock topped out at $116.89 a share. Since that high pivot, it has declined sharply. On Wednesday night, the company reported earnings and the stock fell by $2.54 to $104 per share. The pattern forming on the weekly chart is what we call an 'outside reversal,' usually a very bearish pattern that indicates further downside in the coming weeks. Traders should realize the stock is short-term oversold on the daily chart, so there could be some minor bounces or positive trading days in the stock. But please note, the weekly reversal pattern that has formed is not a sign of strength. This pattern will generally indicate more weekly chart selling down the road.
3 Support Levels To Watch
So where's the support for WDAY? There are several important levels coming up. The first level that I see is the 200-day moving average at $98.42. This moving average will be major daily chart support – if price trades directly into the level. Should price consolidate above the 200-day moving average then that area will become minor support. In other words, watching the pattern develop is extremely important as you have to watch how a stock trades into a particular support level.
The second major support level is around $95, which is where the 50-week moving average is located. This will likely be a major support level when tested as long as price comes directly into that support level.
The next major support area lies around $90.50, where the stock broke out in May 2017. If you have read my work over the years, you know that prior breakout levels are often major chart support when retested. Again, it is very important to see how the stock trades into that level because the chart pattern is always critical and it can change the odds of the trade.

