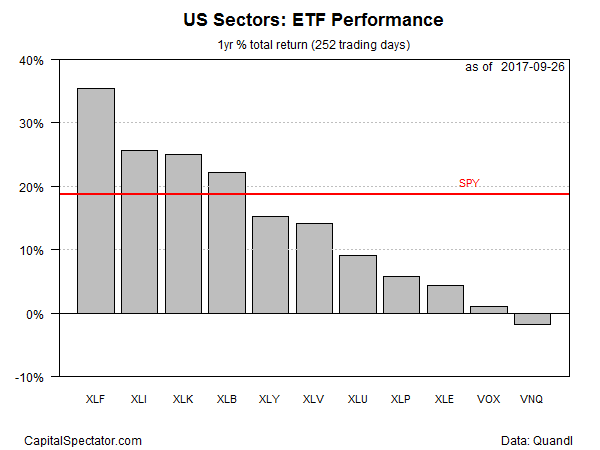
The recent revival in shares of financial stocks has lifted this corner of the US equity market to the top-performing sector for one-year performance, based on a set of ETFs. The change in leadership is also a function of technology’s latest stumble – a slide that’s trimmed the formerly first-place sector’s performance to third for one-year results.
Financial Select Sector SPDR (NYSE:XLF) is currently posting a 35.3% total return for the trailing 12-month period, the strongest one-year gain for US sectors, as of Sep. 26. XLF’s return to the winner’s circle follows a month-long decline that began to reverse in mid-September.
Meanwhile, tech’s bull run has eased in recent days, albeit only modestly so far. Although Technology Select Sector SPDR (NYSE:XLK) is posting on a healthy 24.9% one-year total return, the ETF’s performance rank has eased to third place for the 12-month trend, behind finance and industrials via Industrial Select Sector SPDR (XLI), which has rallied sharply in recent weeks.
The only sector currently posting a loss at the moment: US real estate investment trusts (REITs). Vanguard REIT (NYSE:VNQ) is down 1.8% through yesterday’s close vs. the year-earlier level.
Meantime, the US stock market overall is posting solid gain vs. the year-earlier, based on SPDR S&P 500 (MX:SPY (NYSE:SPY)). The ETF is ahead by 18.6% for the past 12 months (red line in chart below), outperforming seven of the eleven sectors.

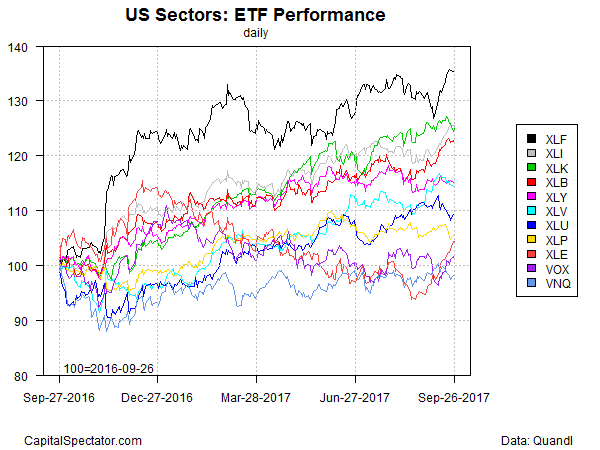
XLF’s renewed dominance for the trailing one-year period is conspicuous in the next chart (black line at top).

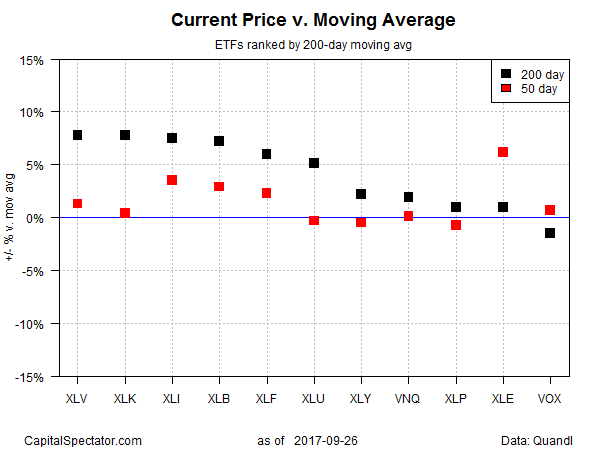
Ranking the sector ETFs by current price relative to 200-day moving average tells a somewhat different story. Healthcare stocks continue to hold the top spot by this standard. The current price premium for Health Care Select Sector SPDR (NYSE:XLV) over its 200-day average is 7.8%, edging out the number-two premium – the tech sector via XLK – by a hair.

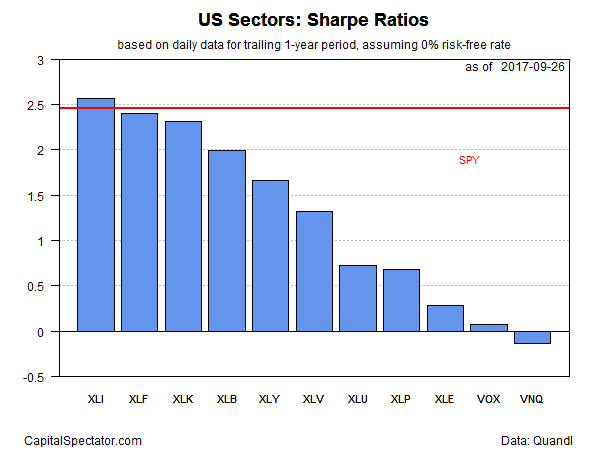
Profiling sector results based on via one-year Sharpe ratio (SR) shows that industrial shares are now in the lead for risk-adjusted performance. By this gauge, XLI’s 2.6 SR leads the field over the past 12 months – modestly above the broad stock market’s 2.5 SR via SPDR S&P 500 (NYSE:SPY).

