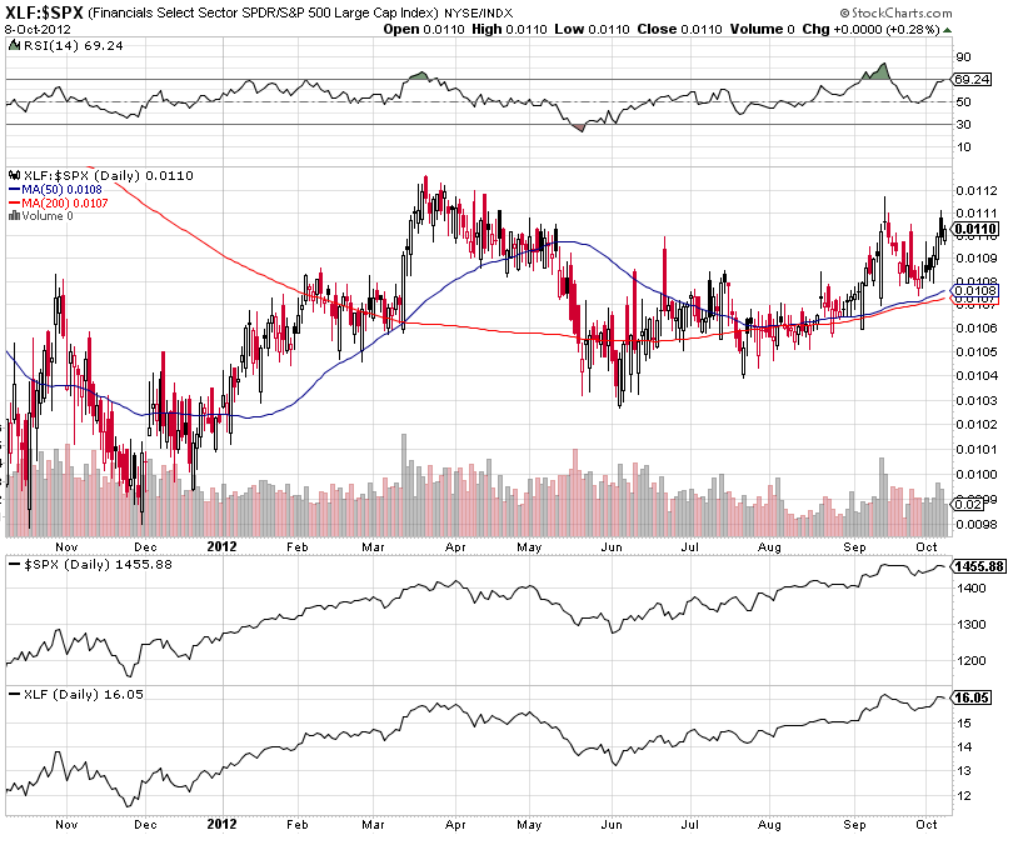
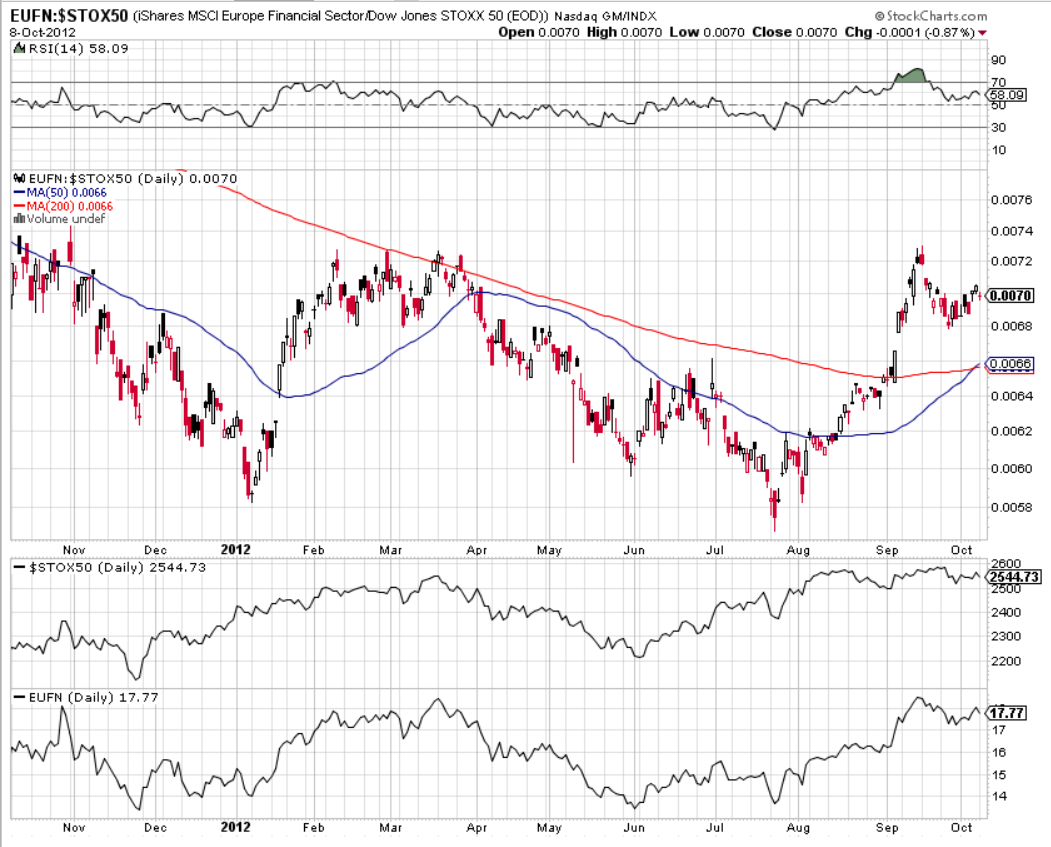
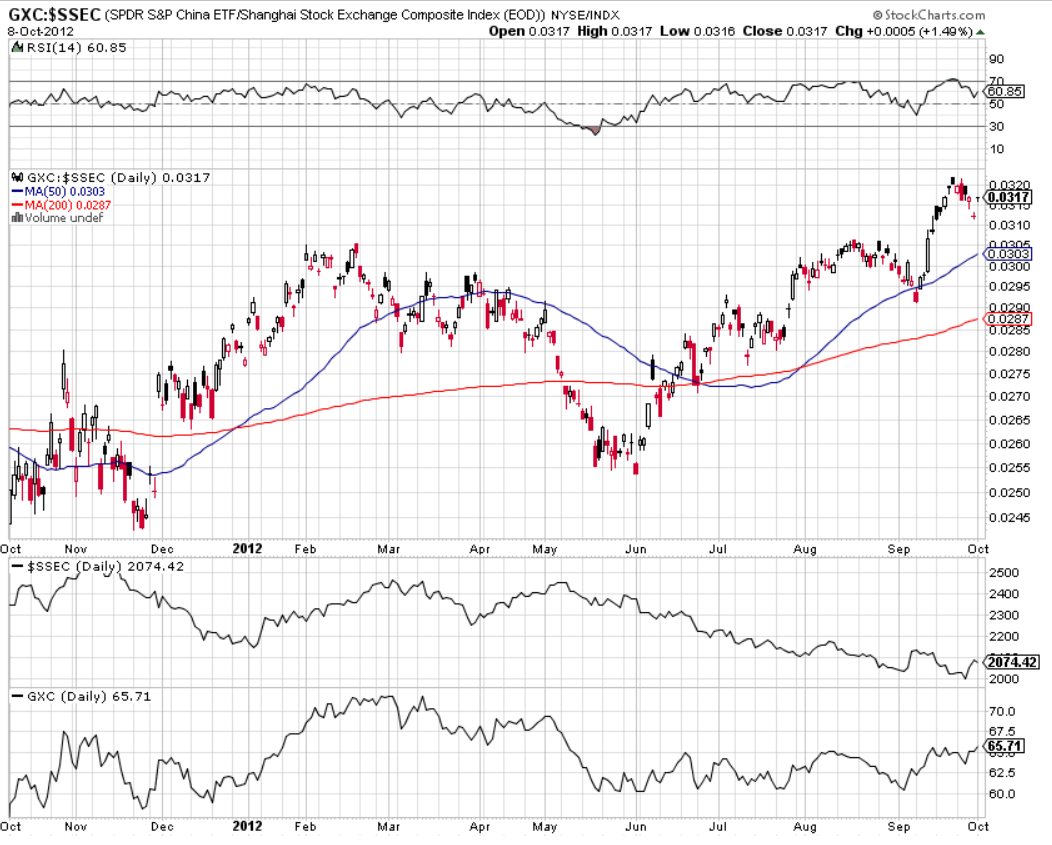
Depicted on the three Daily charts below are a ratio comparison of the Financials ETF to a Major Index in the U.S., European, and Chinese equity markets. They show how the ETF has advanced compared to the Index. In all three cases, the Financials have outperformed the Index.
The U.S. XLF:SPX ratio chart shows that the Financials ETF is up against formidable resistance and the RSI is nearing overbought territory. The rising 50 sma is still holding just above the rising 200 sma. Any breakout above the last swing high would likely be met with more resistance until the RSI reverts back to, at least, the 50 level. We may, however, see another attempt to make a higher swing high first. Under such a scenario, I'd look for a negative RSI divergence to signal that a pullback may be around the corner, which could then send the RSI back to 50, or lower.
The European EUFN:STOX50 ratio chart shows that the Financials ETF is nearing formidable resistance; however, the RSI is not yet overbought. Also, the 50 sma has just crossed above the now-rising 200 sma, forming a bullish "Golden Cross." We may see an attempt at a higher swing high. Under such a scenario, I'd look for a negative RSI divergence before considering that a pullback may be around the corner, which could then send the RSI back to 50, or lower.
The Chinese GXC:SSEC ratio chart shows that the Financials ETF remains firmly in uptrend compared with the Shanghai Index. However, the ETF itself (bottom line chart) is nearing prior major resistance, while the Index (first line chart) remains in downtrend. Both the 50 and 200 smas are in uptrend and the distance between them is widening. The RSI has dipped from its overbought condition, along with a recent pullback in price, but it remains above the 50 level. We may also see an attempt at a higher swing high. Under such a scenario, I'd look for a negative RSI divergence before considering that a pullback may be around the corner, which could then send price down to, perhaps, its 50 sma, or lower, and the RSI below 50.
China is still the wild card of this group, and both their Financials ETF and Shanghai Index are important ones to watch for any signs of further weakening and a potential "falling off a cliff" on the Index. Such a scenario, if left to deteriorate further without a stabilizing influence of monetary and/or fiscal/economic intervention, may have a negative global impact on, particularly, the European and U.S. equity markets.
- English (UK)
- English (India)
- English (Canada)
- English (Australia)
- English (South Africa)
- English (Philippines)
- English (Nigeria)
- Deutsch
- Español (España)
- Español (México)
- Français
- Italiano
- Nederlands
- Português (Portugal)
- Polski
- Português (Brasil)
- Русский
- Türkçe
- العربية
- Ελληνικά
- Svenska
- Suomi
- עברית
- 日本語
- 한국어
- 简体中文
- 繁體中文
- Bahasa Indonesia
- Bahasa Melayu
- ไทย
- Tiếng Việt
- हिंदी
Financials ETF Vs. Major Indices In U.S, Europe And China
Published 10/09/2012, 02:24 AM
Updated 07/09/2023, 06:31 AM
Financials ETF Vs. Major Indices In U.S, Europe And China
Latest comments
Loading next article…
Install Our App
Risk Disclosure: Trading in financial instruments and/or cryptocurrencies involves high risks including the risk of losing some, or all, of your investment amount, and may not be suitable for all investors. Prices of cryptocurrencies are extremely volatile and may be affected by external factors such as financial, regulatory or political events. Trading on margin increases the financial risks.
Before deciding to trade in financial instrument or cryptocurrencies you should be fully informed of the risks and costs associated with trading the financial markets, carefully consider your investment objectives, level of experience, and risk appetite, and seek professional advice where needed.
Fusion Media would like to remind you that the data contained in this website is not necessarily real-time nor accurate. The data and prices on the website are not necessarily provided by any market or exchange, but may be provided by market makers, and so prices may not be accurate and may differ from the actual price at any given market, meaning prices are indicative and not appropriate for trading purposes. Fusion Media and any provider of the data contained in this website will not accept liability for any loss or damage as a result of your trading, or your reliance on the information contained within this website.
It is prohibited to use, store, reproduce, display, modify, transmit or distribute the data contained in this website without the explicit prior written permission of Fusion Media and/or the data provider. All intellectual property rights are reserved by the providers and/or the exchange providing the data contained in this website.
Fusion Media may be compensated by the advertisers that appear on the website, based on your interaction with the advertisements or advertisers.
© 2007-2025 - Fusion Media Limited. All Rights Reserved.
