Here is a post from Sober Look that has some really good charts on the changing asset mix at US banks. I was a little surprised that they didn’t point out the obvious connection in the charts, although they do make some key points in a previous post.
To summarize: the charts show that the loan-to-deposit ratio in the banking system recently hit a 35-year low, and that the proportion of cash on the balance sheet of banks has gone from maybe 5% to around 20% (eyeballing it) in the last ten years.
Obviously, these two facts are not unconnected, since loans and cash are both assets to banks. The reason for the shift from loans to cash is very simple: QE. Banks don’t want to hold as much cash (reserves) as they are carrying, but the alternative is to lend it to people in sub-optimal loans – that is, where the interest rate charged does not compensate for the risk that the loan will not be paid back, so that the lending has a negative NPV. Moreover, the cash itself has a positive return because the Fed is paying interest on excess reserves, so that the lending has a higher hurdle to achieve than it would if this was just “normal” cash or reserves.
Understanding this dynamic is really important. So here’s how this works: if interest rates rise, but reserves have the same yield, then lending becomes more profitable and loans will increase – that is, the money multiplier will rise, with less money in the vault and more money in transactional accounts. If, on the other hand, the Fed raises the interest on excess reserves while lending rates stay unchanged, then even fewer loans will be made and banks will hold more cash relative to loans. This is one mechanism by which higher interest rates initially encourage higher inflation.
(And yes, while the total amount of reserves in the system is fixed, the total amount of loans is not, so while the Fed controls the former they do not control the latter except indirectly).
So, consider the “exit” strategy. As interest rates rise, the multiplier will increase unless the Fed hikes interest on excess reserves. But since interest rates move more flexibly, more rapidly, and often further than do policy rates, this probably means the multiplier will be determined mostly by the market (I wonder if the Fed declared the IOER to be “10-year yields minus 250bps” if that would change things?). The gap is the thing. And, if Yellen actually cuts the IOER to zero, as she has intimated is possible, then the multiplier would rise…and we don’t know by how much.
On the flip side, if the Fed tapers QE to zero, and lending rates fall, then the multiplier would tend to fall further because that gap narrows. In that case, you really could get a disinflationary scenario…though I am skeptical that long rates can fall very much when public debt is so high and the Fed is withdrawing its support for the bond market. Still, a crisis could do it. To be clear: you’d need the Fed to stop adding reserves, to neglect the IOER – or increase it – and long rates to decline substantially (at least 100bps, say). So if you are a deflationist, there are your signposts. I don’t anticipate that any of that happening, except that I imagine they will screw up the IOER strategy and they could screw that up in either direction.
And by the way, I don’t think any of that would affect inflation much in 2014, since higher housing prices are already going to be pressing core inflation higher. But it could affect 2015.
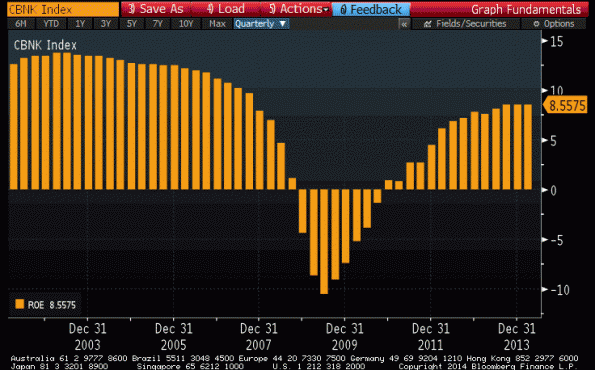
However, I digress from the other point I wanted to make that was suggested by the Sober Look article, and that is this: it continues to amaze me how well bank stocks are trading. I’ve been saying this for years – which helps to illustrate that I am a strategic investor, not a twitchy tactical guy. Return on equity equals gross margin (profit/revenue), times asset turnover (revenue/assets), times leverage (assets/equity), and for banks all three of these components are under pressure. Gross margin is under pressure from the movement of more products to electronic trading and from increasing legal bills at banks (the FX trading scandal is the latest threat of multibillion-dollar fines, adding to the LIBOR scandal and probes of the gold and silver price fixing system as sources of legal headaches for banks). Banks have been forced via the crisis to shed leverage, as a chart I recently ran illustrated. And low interest rates combined with large amounts of cash compared to loans on the balance sheet pressures the asset turnover statistic. So it isn’t surprising that bank ROEs are low (see chart of the NASDAQ bank index ROEs, source Bloomberg). 
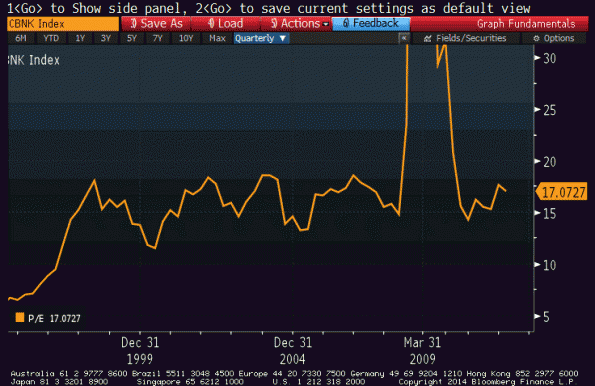
What is surprising is that they even got this high, and market pricing seems to anticipate that they’ll keep rising. Bank stocks are actually outperforming the S&P since late 2011, and their P/E ratios are essentially where they have always been, excluding the spike when earnings collapsed in the crisis, causing P/Es to skyrocket (see chart, source Bloomberg).
Maybe all the bad news is already in the price of bank stocks, but it doesn’t look like it to me.

