
Chart 1: Financial sector is showing warning signs of a major top
In one of the recent posts, I showed how Health Care sector breadth divergence could be signalling that an uptrend might stall soon enough. Participation and leadership by various stocks is slowly dwindling to lower and lower numbers. The same is true for the Financial sector of the S&P 500. The chart above shows that the Financial sector bearish divergences are evident in the Summation Index, % of stocks above 200 MA and 52 week new highs.
Chart 2: Financial sector has been failing to push towards new highs!
So why is the Financial sector so important? I could do a whole write up about how banks are the arteries and credit creation is the blood of the economy, but I will spare you the thesis - I'm sure you can read plenty of them on all other blogs. The truth is, Financials (XLF) lead the rally out of the October 2011 low. Now, almost two years later, the sector has doubled in value, looks overbought and exhausted to move higher. Recently, it failed to confirm the new highs S&P 500 reached in September - sure warning sign.
Chart 3: Financial sector tends to anticipate a turn in major trend 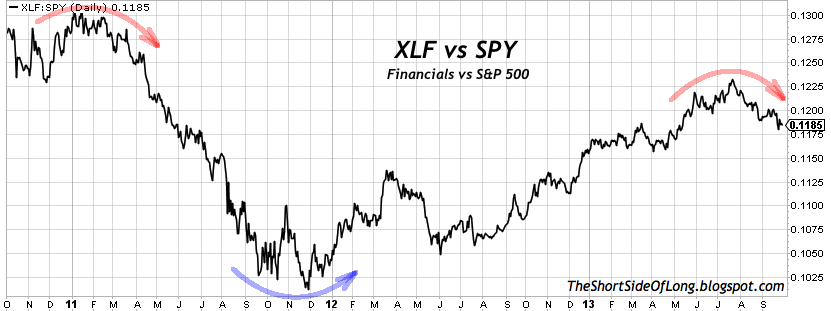
During the major market top in October 2007, and even more recently in May 2011, Financial sector was the "tell-tell" by peaking months before the final high. This type of price action usually signals that not all is well within the stock market. Fast forward to todays price action and the chart above clearly shows Financial sector underperformance relative to the whole S&P 500 yet again. It is a false signal, just a correction or a major bear ahead? It remains to be seen... but please do not be surprised that it is happen again, after all we just continue to kick the can down the road in the US, Japan and Europe!
- English (UK)
- English (India)
- English (Canada)
- English (Australia)
- English (South Africa)
- English (Philippines)
- English (Nigeria)
- Deutsch
- Español (España)
- Español (México)
- Français
- Italiano
- Nederlands
- Português (Portugal)
- Polski
- Português (Brasil)
- Русский
- Türkçe
- العربية
- Ελληνικά
- Svenska
- Suomi
- עברית
- 日本語
- 한국어
- 简体中文
- 繁體中文
- Bahasa Indonesia
- Bahasa Melayu
- ไทย
- Tiếng Việt
- हिंदी
Financial Sector: A Bearish Signal
Latest comments
Loading next article…
Install Our App
Risk Disclosure: Trading in financial instruments and/or cryptocurrencies involves high risks including the risk of losing some, or all, of your investment amount, and may not be suitable for all investors. Prices of cryptocurrencies are extremely volatile and may be affected by external factors such as financial, regulatory or political events. Trading on margin increases the financial risks.
Before deciding to trade in financial instrument or cryptocurrencies you should be fully informed of the risks and costs associated with trading the financial markets, carefully consider your investment objectives, level of experience, and risk appetite, and seek professional advice where needed.
Fusion Media would like to remind you that the data contained in this website is not necessarily real-time nor accurate. The data and prices on the website are not necessarily provided by any market or exchange, but may be provided by market makers, and so prices may not be accurate and may differ from the actual price at any given market, meaning prices are indicative and not appropriate for trading purposes. Fusion Media and any provider of the data contained in this website will not accept liability for any loss or damage as a result of your trading, or your reliance on the information contained within this website.
It is prohibited to use, store, reproduce, display, modify, transmit or distribute the data contained in this website without the explicit prior written permission of Fusion Media and/or the data provider. All intellectual property rights are reserved by the providers and/or the exchange providing the data contained in this website.
Fusion Media may be compensated by the advertisers that appear on the website, based on your interaction with the advertisements or advertisers.
© 2007-2025 - Fusion Media Limited. All Rights Reserved.