
The financial sector is unique in that it is an essential component of global economics as well as local economic functions. Consumers depend on banking services, credit and all sorts of other financial services in their day-to-day lives. The financial sector is one of the components of the U.S. stock market that can suddenly find itself under pricing pressure as an economic crisis event unfolds. This happens because banks earn a large portion of their income from servicing debt and originating loans.
The recent rally in the financial sector, over 47% from the March 2020 lows, has reached our proprietary Fibonacci price modelling system's upside price targets and has also filled a major gap that was created in early March 2020. Because of these factors, and the current downside price rotation within the financial sector, we believe this component of the U.S. stock market could continue to see extended pricing pressure going forward as we learn just how damaging the past 70+ days of the economic shutdown have been for the economy.
We do know that certain consumers have quickly begun to pay off credit card debt. We believe this is a learned trait from the 2008-09 market crisis, where credit card rates skyrocketed as large numbers of
consumers began defaulting on their homes and other types of credit. We also know that delinquencies for autos and other sub-prime credit services have begun to skyrocket higher. The sub-prime credit
market is vastly different than it was in 2008-09. Recently, Fintech and other new resources have allowed for extended sub-prime lending and leveraging within the U.S. (Source: cnbc.com).
When you combine the sub-prime mortgage, auto, personal loans, personal Fintech margin capabilities, and sub-AAA corporate debt levels, the total amount of at-risk subprime debt must exceed $2 trillion
U.S. dollars. We believe this source of risk has been greatly underestimated in terms of risk to the financial sector over the next 12+ months (Source: zerohedge.com).
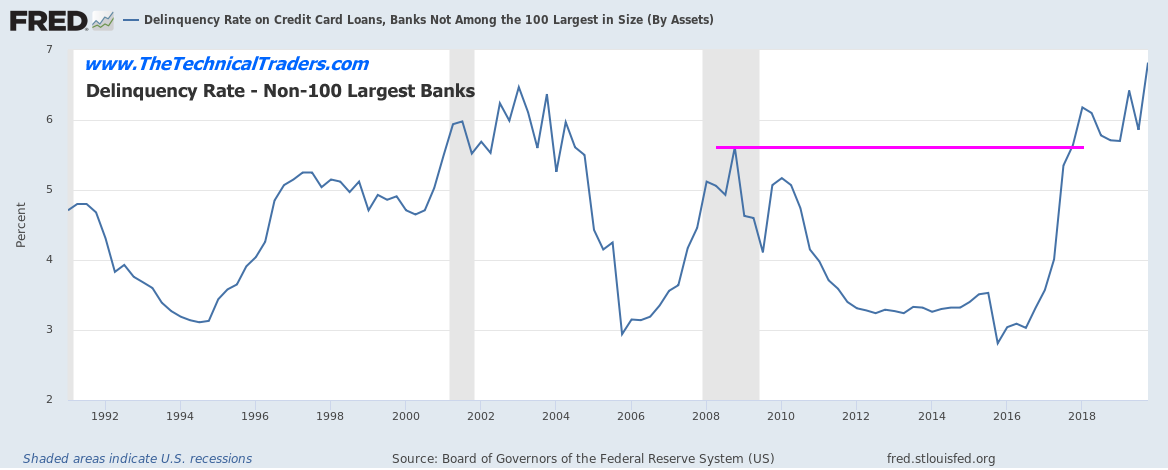
Non-100 Largest Banks Credit Card Delinquency Rates
The current delinquency rate among the non-100 largest U.S. banks for credit cards has already climbed well above the 2008-2010 peak levels. It appears sub-prime borrowers are already pushed well beyond their limits in terms of servicing current debt levels. This suggests a contraction in the credit market will likely take place over the next 24+ months as these at-risk borrowers default at greater rates. This could transition into the housing market and other sectors of the economy if multiple waves of sub-prime borrowers stress the U.S. financial system because of the COVID-19 shutdown.
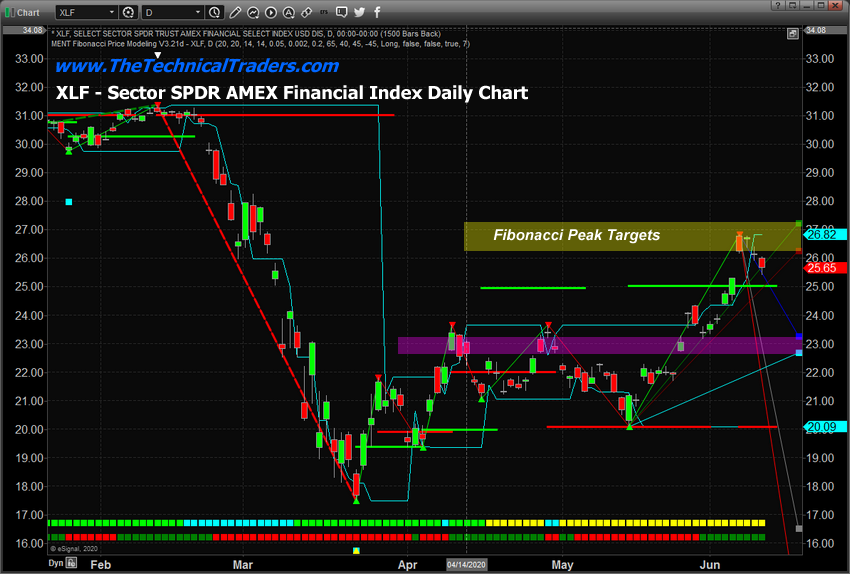
XLF Financial ETF Index Daily Chart
Our research team believes the peak in the (NYSE:XLF) ETF has already set up after the recent 47%+ rally from the March lows. The $27 price peak sets up directly between our two Fibonacci Daily upside price target (peak) levels. We believe this setup is a very strong indication that a move to below $23mmay be setting up over the next 30+ days. The Q2 data may very well push investors to re-evaluate the potential for the financial sector if delinquencies and at-risk borrowers continue to default in greater numbers.
XLF Financial ETF Index Weekly Chart
This XLF Weekly chart highlights the recent rally and the “gap” that recently filled. It is our belief that the range between the MAGENTA horizontal lines represents a very clear support/resistance level within this longer-term XLF chart. We believe that price will have to fall below $25 in order to initiate a deeper downside price move targeting recent low price levels or price will have to move above $27.50 in order to continue to rally. Currently, our researchers believe the downside potential has a much higher probability of success as we get closer to the end of Q2:2020.
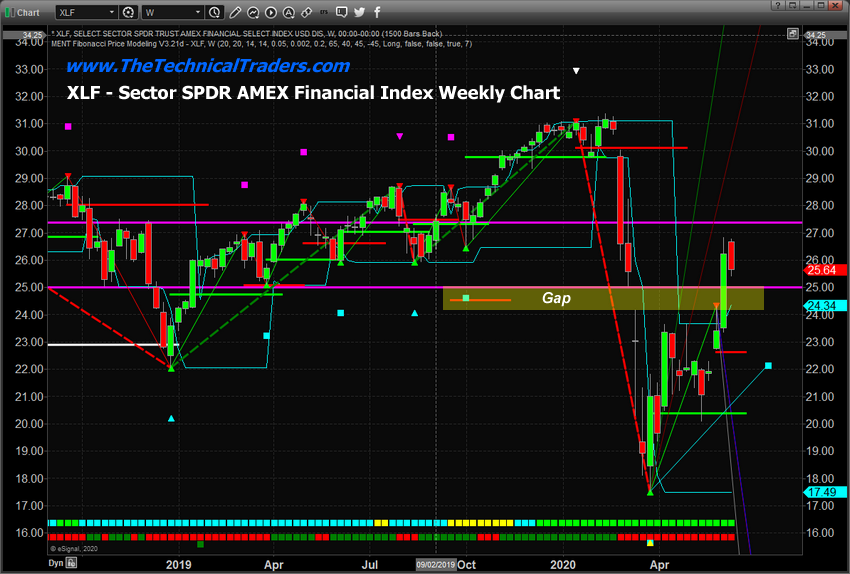
If our research is correct and XLF falls below the $25 price level, we believe it will target at least $22 to $22.50 before finding some support. If it breaks below the $22 price level, it could fall well below the $20 price level again on weaker expectations.