After five long years, the gold price has finally broken through a key resistance level and is now heading towards $1,400. When the Fed announced possible rate cuts starting in July, after the market closed, the gold price shot up and continued higher during Asian trading. If gold closes above $1,400 by the end of the month, it could be setting the stage for another large bull market.
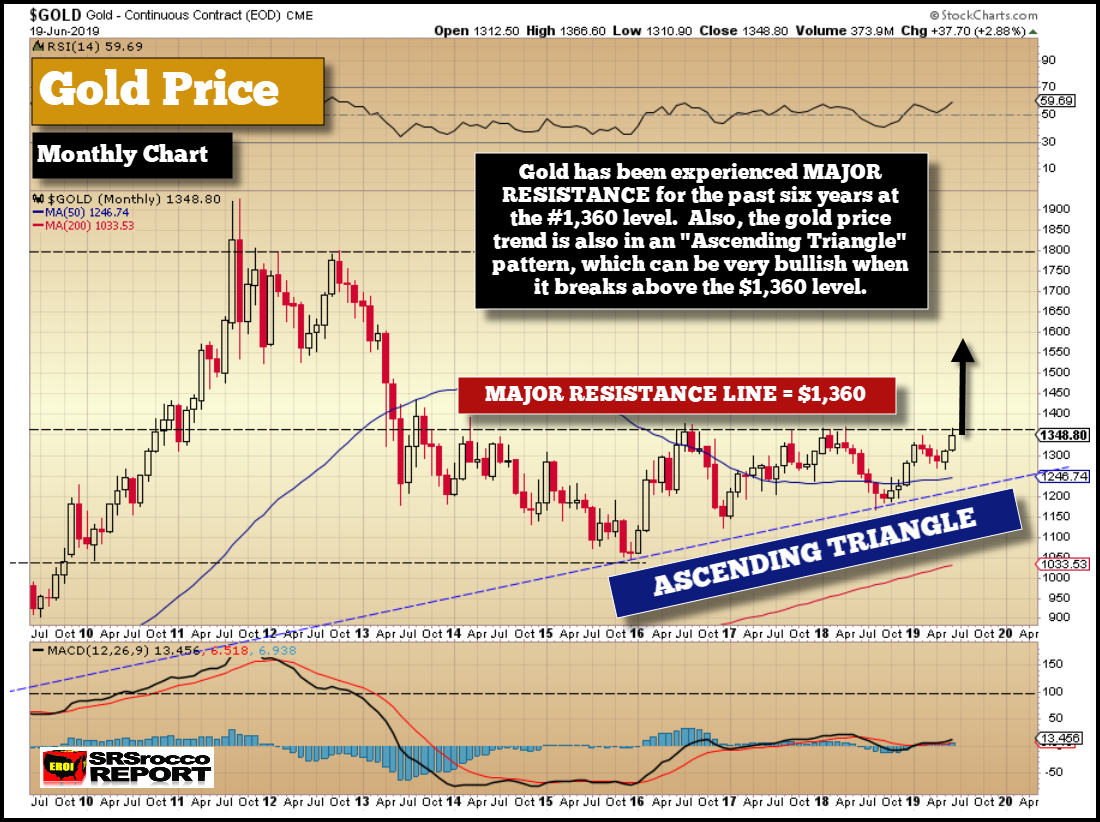
While many precious metals investors don’t follow technical analysis, traders and major markets movers are certainly paying attention. And, the gold price has been stuck below the key $1,360 technical level for the past five years:

You will notice that the black dashed line at $1,360 hasn’t been broken (closed above it on a monthly basis) since 2014. While the gold price has shot above $1,360 on several occasions, it has not closed above that line on a monthly basis since 2013. This chart shows the gold price as of the close at 2 pm today.
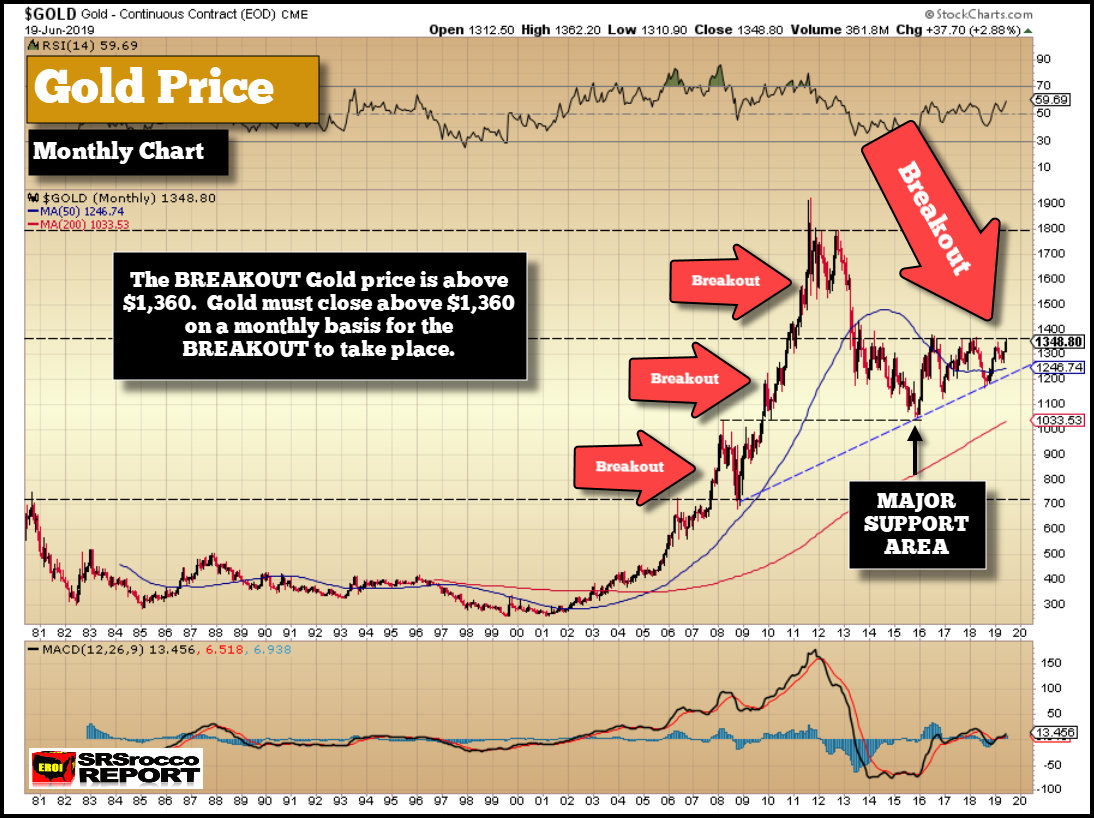
Traders have been watching the gold technical levels for years and are now getting serious as the BREAKOUT above $1,360 is a KEY LEVEL of RESISTANCE. If we look at a longer Gold Monthly chart going back until 1981, you will see what I mean:

When gold fell below $700 back in 1981, it stayed below it for more than 26 years. However, when it finally broke above it in 2007, it shot up to $1,000. Then we see the next two BREAKOUT LEVELS. When gold fell below the $1,360 level in 2014, it has stayed below it, but has been bouncing off the rising BLUE TREND LINE.
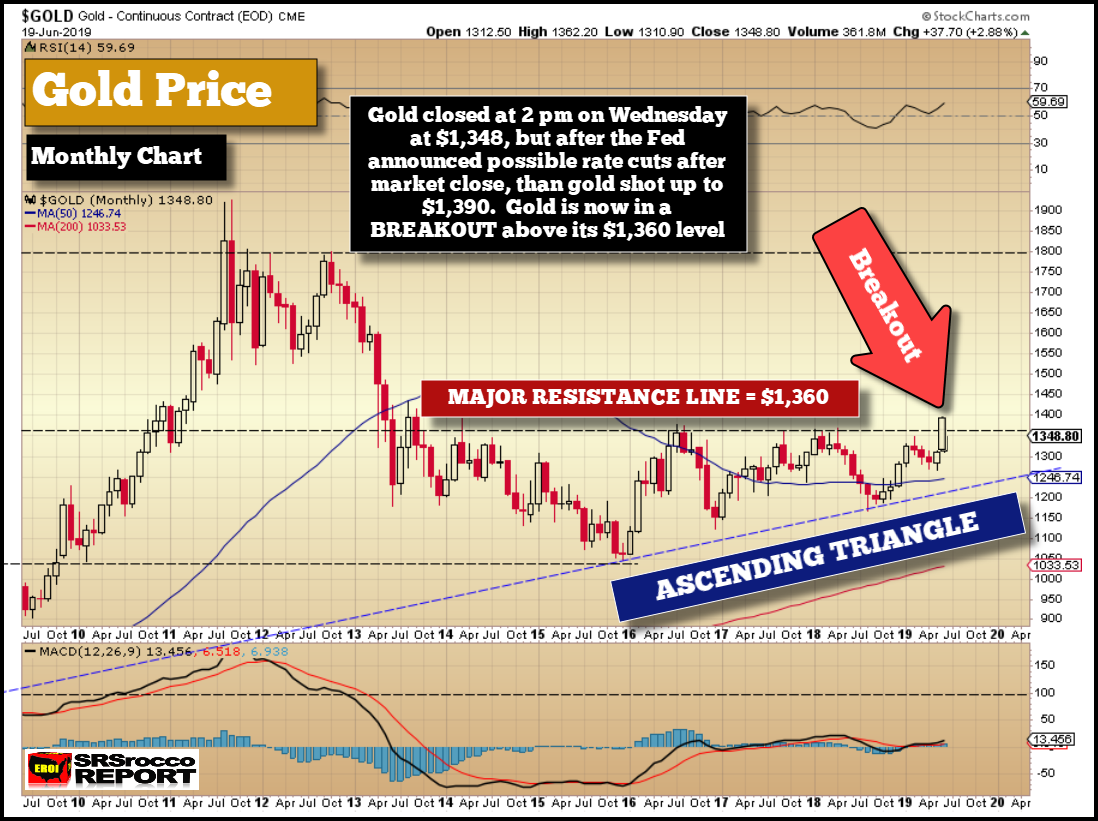
Also, over the past several years, gold has been trading in an ASCENDING TRIANGLE (blue & black dashed lines). Once an ascending triangle is broken above the top line, it can be very bullish for the price action. The next chart shows the BREAKOUT that took place during Asian trading as gold price hit $1,390+ :

If the gold price closes well above the $1,360 level, that will be quite positive for the price action going forward. So, it will be interesting to see what happens during trading in the U.S. markets tomorrow.
