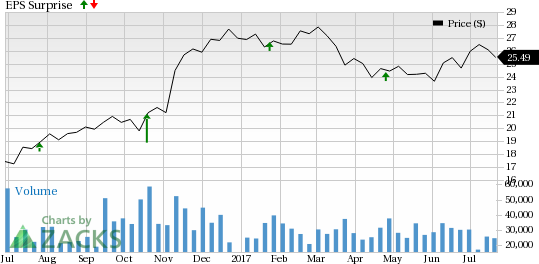
Fifth Third Bancorp (NASDAQ:FITB) reported second-quarter 2017 adjusted earnings per share of 46 cents, surpassing the Zacks Consensus Estimate of 42 cents. The adjusted figure excludes the impact of a non-recurring item.
Better-than-expected results were driven by an increase in net interest income and lower provisions. Also, improved credit quality was a tailwind. However, lower non-interest income was an undermining factor.
Net income available to common shareholders decreased 13% year over year to $344 million.
Lower Non-interest Income Impacts Revenues, Expenses Decline
Total revenue for the quarter came in at $1.50 billion, lagging the Zacks Consensus Estimate of $1.53 billion. Reported revenues were stable year over year.
Fifth Third’s net interest income (tax equivalent) came in at $945 million, up 4% year over year. The rise was primarily driven by higher short-term market rates.
Net interest margin expanded 13 basis points (bps) year over year to 3.01%, mainly due to improved short-term market rates.
Non-interest income dropped 6% year over year to $564 million (including certain non-recurring items). Excluding significant items, non-interest income was down 5% year over year to $571 million. Notably, the quarter witnessed a fall in almost all components of income, partially offset by higher revenues from other income, service charges on deposits as well as wealth and asset management.
However, non-interest expenses decreased 3% year over year to $957 million. The fall was due to lower net occupancy expense, equipment, card and processing, and other expenses.
As of Jun 30, 2017, average loan and lease balances were almost stable sequentially at $92.7 billion. Average total deposits declined 1% from the previous quarter to $102.5 billion.
Credit Quality Improves
Provision for loan and lease losses declined 43% year over year to $52 million. Net losses charge-offs for the quarter came in at $95 million or 28 bps of average loans and leases on an annualized basis compared with $87 million or 37 bps in the prior-year quarter.
Total non-performing assets, including loans held for sale, were $670 million, down 19% from the year-ago quarter. Total allowance for credit losses was $1.39 billion, down 4% from the prior-year quarter.
Strong Capital Position
Fifth Third remained well capitalized in the quarter. Tier 1 risk-based capital ratio was 11.76% compared with 11.03% at the end of the prior-year quarter. CET1 capital ratio (fully phased-in) was 10.52% compared with 9.86% at the end of the year-ago quarter. Tier 1 leverage ratio was 10.07% compared with 9.64% in the prior-year quarter.
Our Viewpoint
We believe that the company, with a diversified traditional banking platform, remains well poised to benefit from recovery of the economies where it has footprint. Steady improvement in loan balance highlights its efficient organic growth strategy. Further, the company’s improving credit quality and strong balance sheet should drive better results in the upcoming quarters. However, declining non-interest income keeps us apprehensive.
Fifth Third currently carries a Zacks Rank #3 (Hold). You can see the complete list of today’s Zacks #1 Rank (Strong Buy) stocks here.
Fifth Third Bancorp Price and EPS Surprise
Performance of Other Banks
Driven by high net interest income, U.S. Bancorp (NYSE:USB) reported a positive surprise of 1.2% in second-quarter 2017. The company reported earnings per share of 85 cents, beating the Zacks Consensus Estimate by a penny. Results also came ahead of the prior-year quarter earnings of 83 cents.
First Horizon National Corporation (NYSE:FHN) reported second-quarter 2017 adjusted earnings per share of 27 cents, surpassing the Zacks Consensus Estimate by a penny. Further, the figure reflects an increase of 12.5% from the year-ago quarter.
Comerica Inc. (NYSE:CMA) reported a positive earnings surprise of 7.5% in second-quarter 2017. Adjusted earnings per share of $1.15 surpassed the Zacks Consensus Estimate of $1.07. The adjusted figure excludes restructuring charges and tax benefit from employee stock transactions.
Will You Make a Fortune on the Shift to Electric Cars?
Here's another stock idea to consider. Much like petroleum 150 years ago, lithium power may soon shake the world, creating millionaires and reshaping geo-politics. Soon electric vehicles (EVs) may be cheaper than gas guzzlers. Some are already reaching 265 miles on a single charge.
With battery prices plummeting and charging stations set to multiply, one company stands out as the #1 stock to buy according to Zacks research.
It's not the one you think.
See This Ticker Free >>
Comerica Incorporated (CMA): Free Stock Analysis Report
U.S. Bancorp (USB): Free Stock Analysis Report
Fifth Third Bancorp (FITB): Free Stock Analysis Report
First Horizon National Corporation (FHN): Free Stock Analysis Report
Original post
Zacks Investment Research

