Don't be deceived by the lack of sizable moves in the currencies. They just want to lull you to sleep as they set sail on their next moves. By then, it could be too late to catch them. Doing so would certainly expose you to more risk while decreasing the potential reward. Better to keep a watchful eye now. We did and found several new opportunities well worth paying attention to.
EUR/USD: So Far Still Consolidating
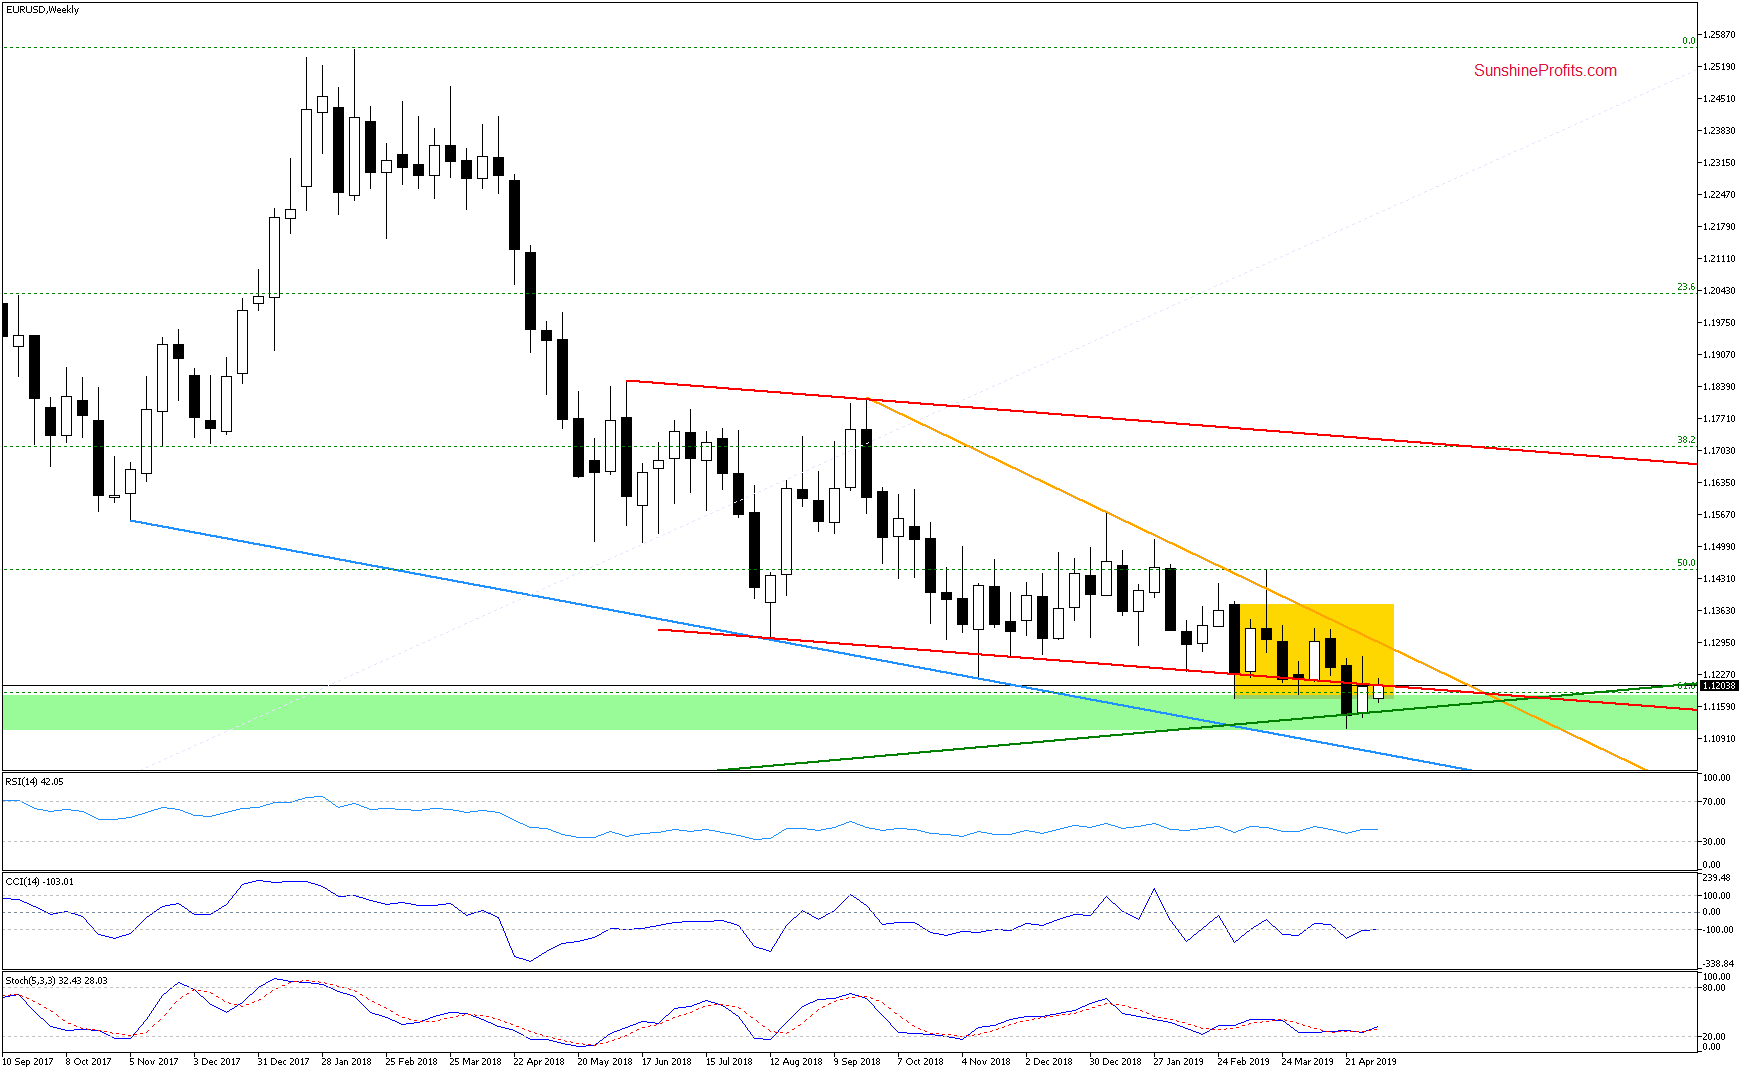
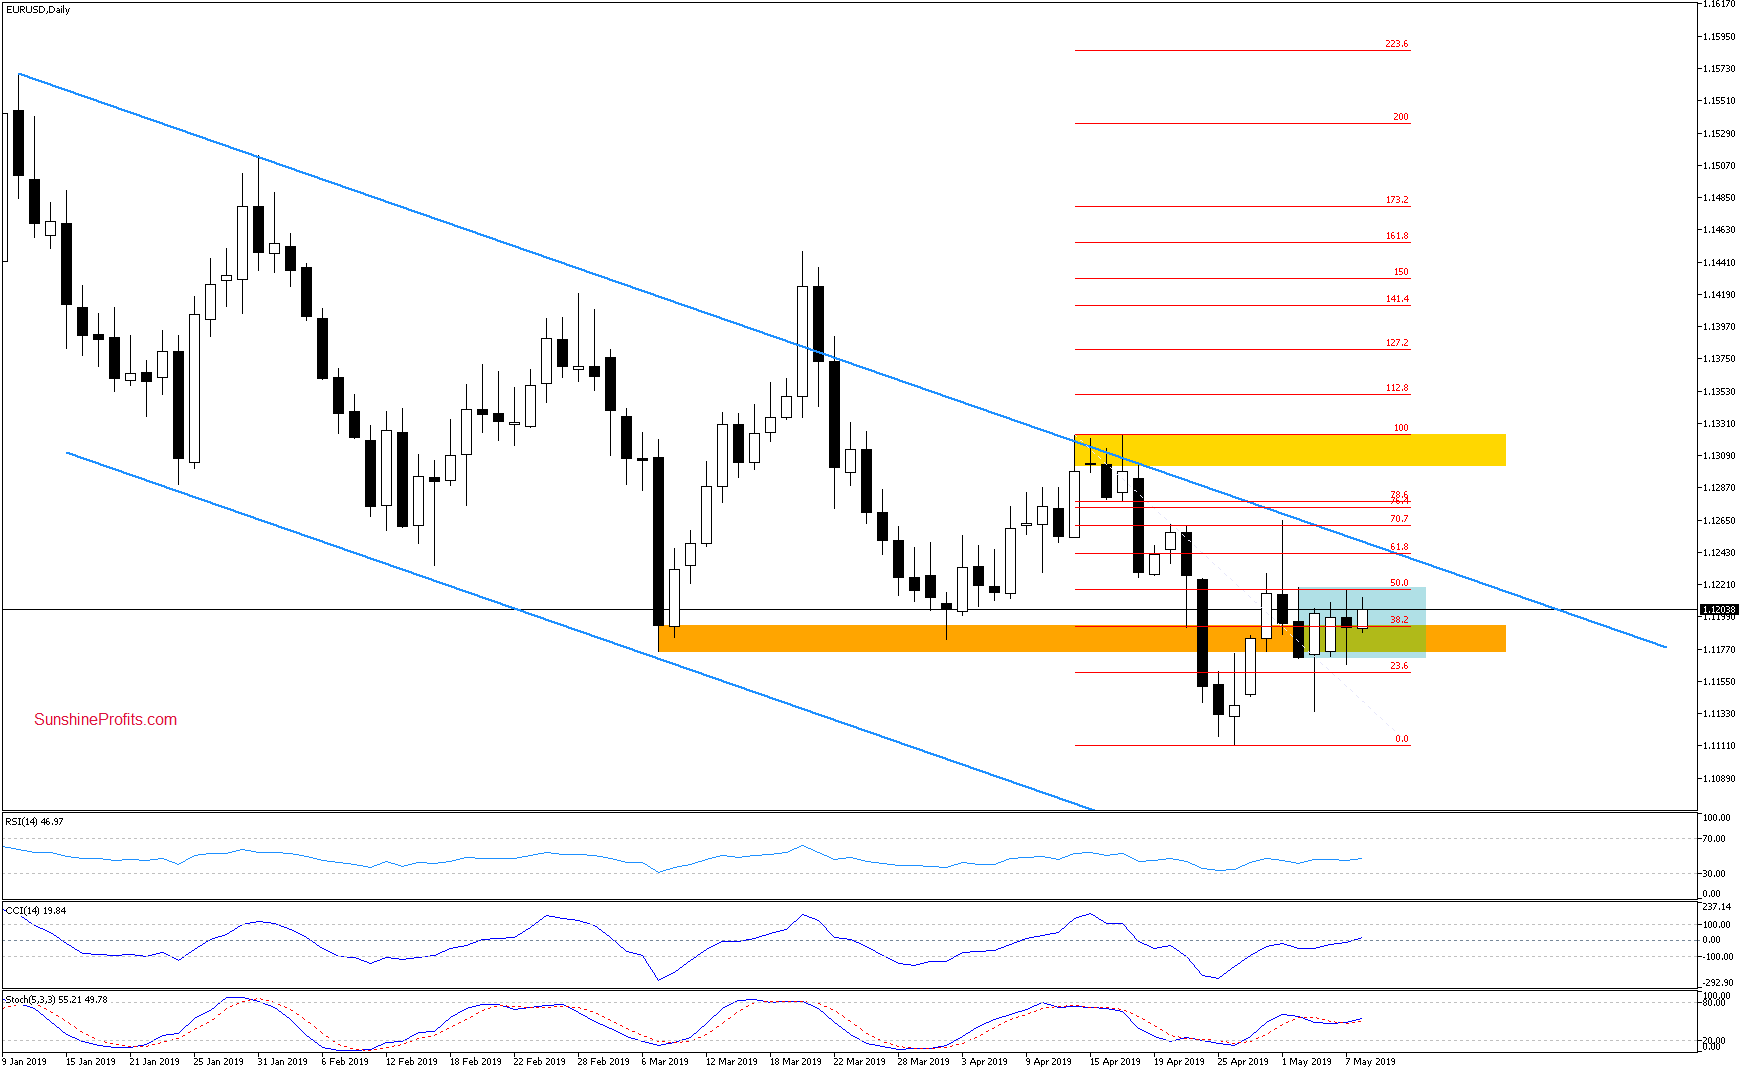
Looking at both the weekly and daily chart, we see that the EUR/USD situation hasn't changed much. The pair is still trading in the narrow blue consolidation that is located between the orange support zone and the strong resistance area created by the 50% Fibonacci retracement (as seen on the daily chart) and the lower border of the red declining trend channel (as seen on the weekly chart).
As long as there is no successful breakout above them that would invalidate the previous breakdown below, higher values of the exchange rate are not likely to be seen. Another downward reversal in the coming days should not surprise us.
USD/CAD: A Consolidation That Appears To Be Running Its Course
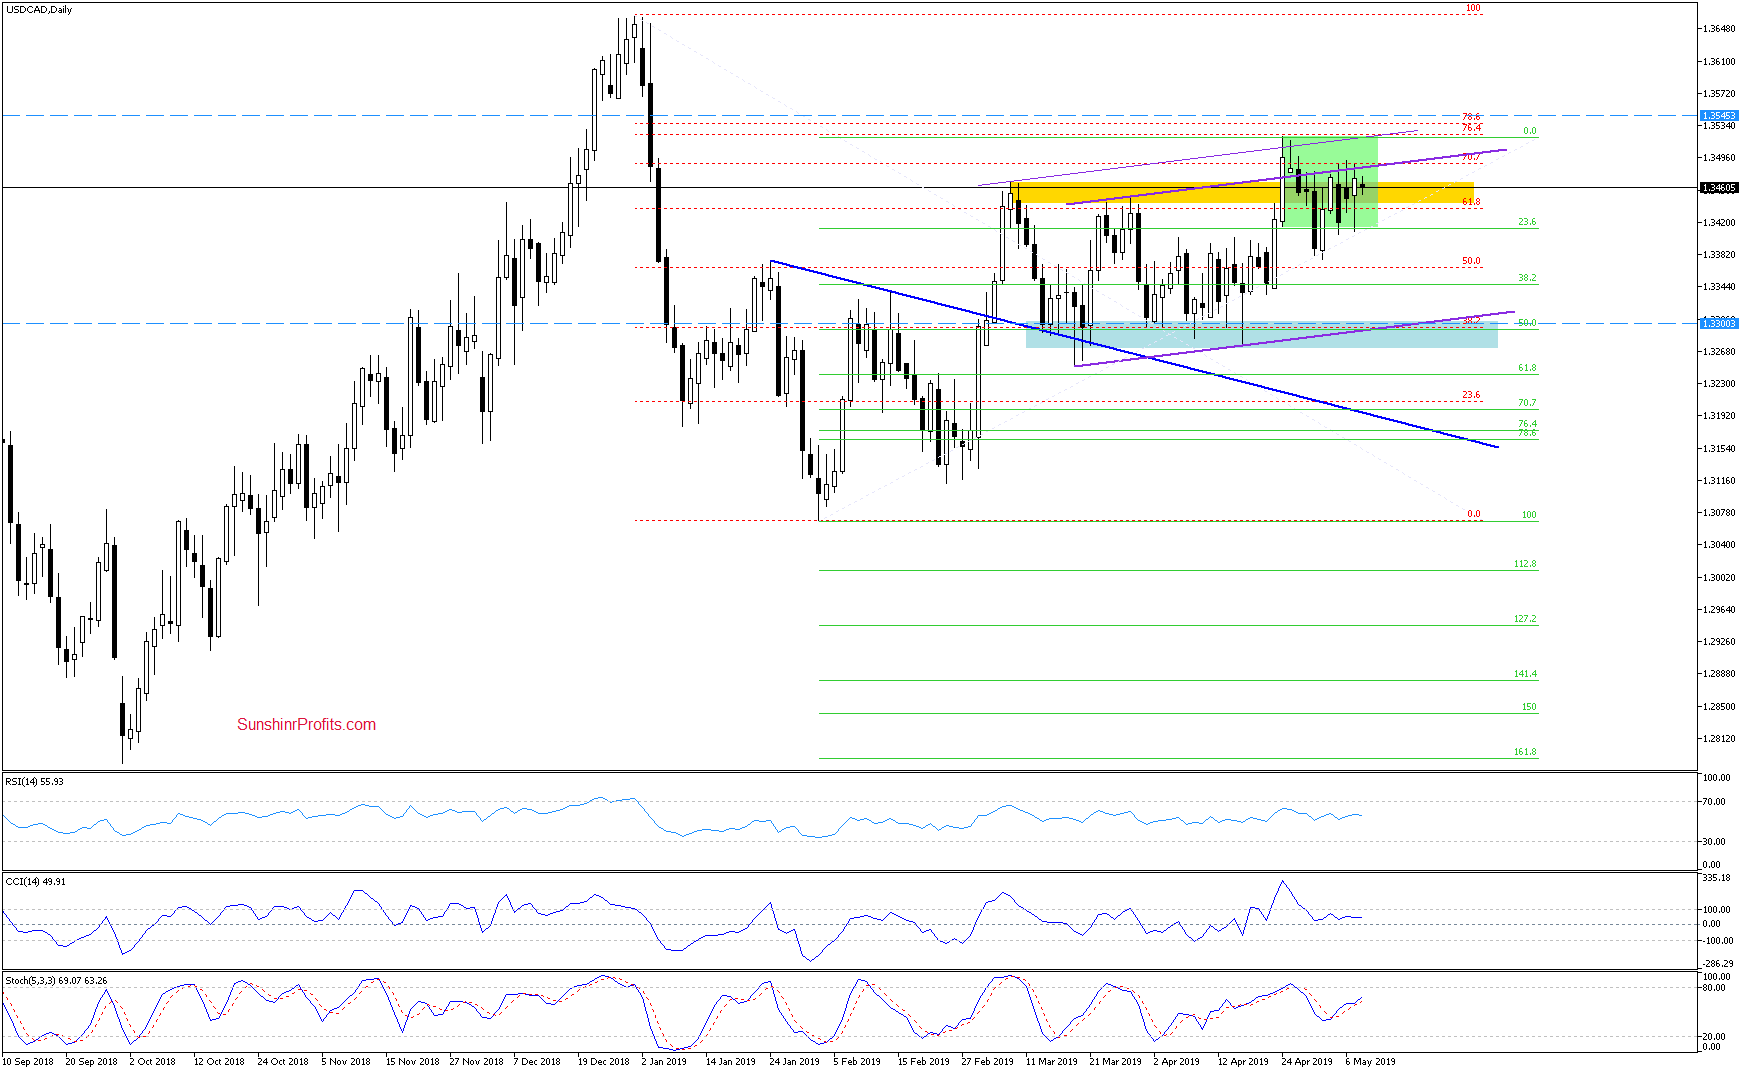
Neither the short-term situation in USD/CAD has changed much. The pair is still trading inside the green consolidation.
Looking at the dynamics between the buyers and the sellers, we see that the buyers didn't manage to break above the upper border of the rising purple trend channel and the 70.7% Fibonacci retracement once again. This increases the probability of lower values being just around the corner. Especially so when we factor in the situation on the higher timeframe.
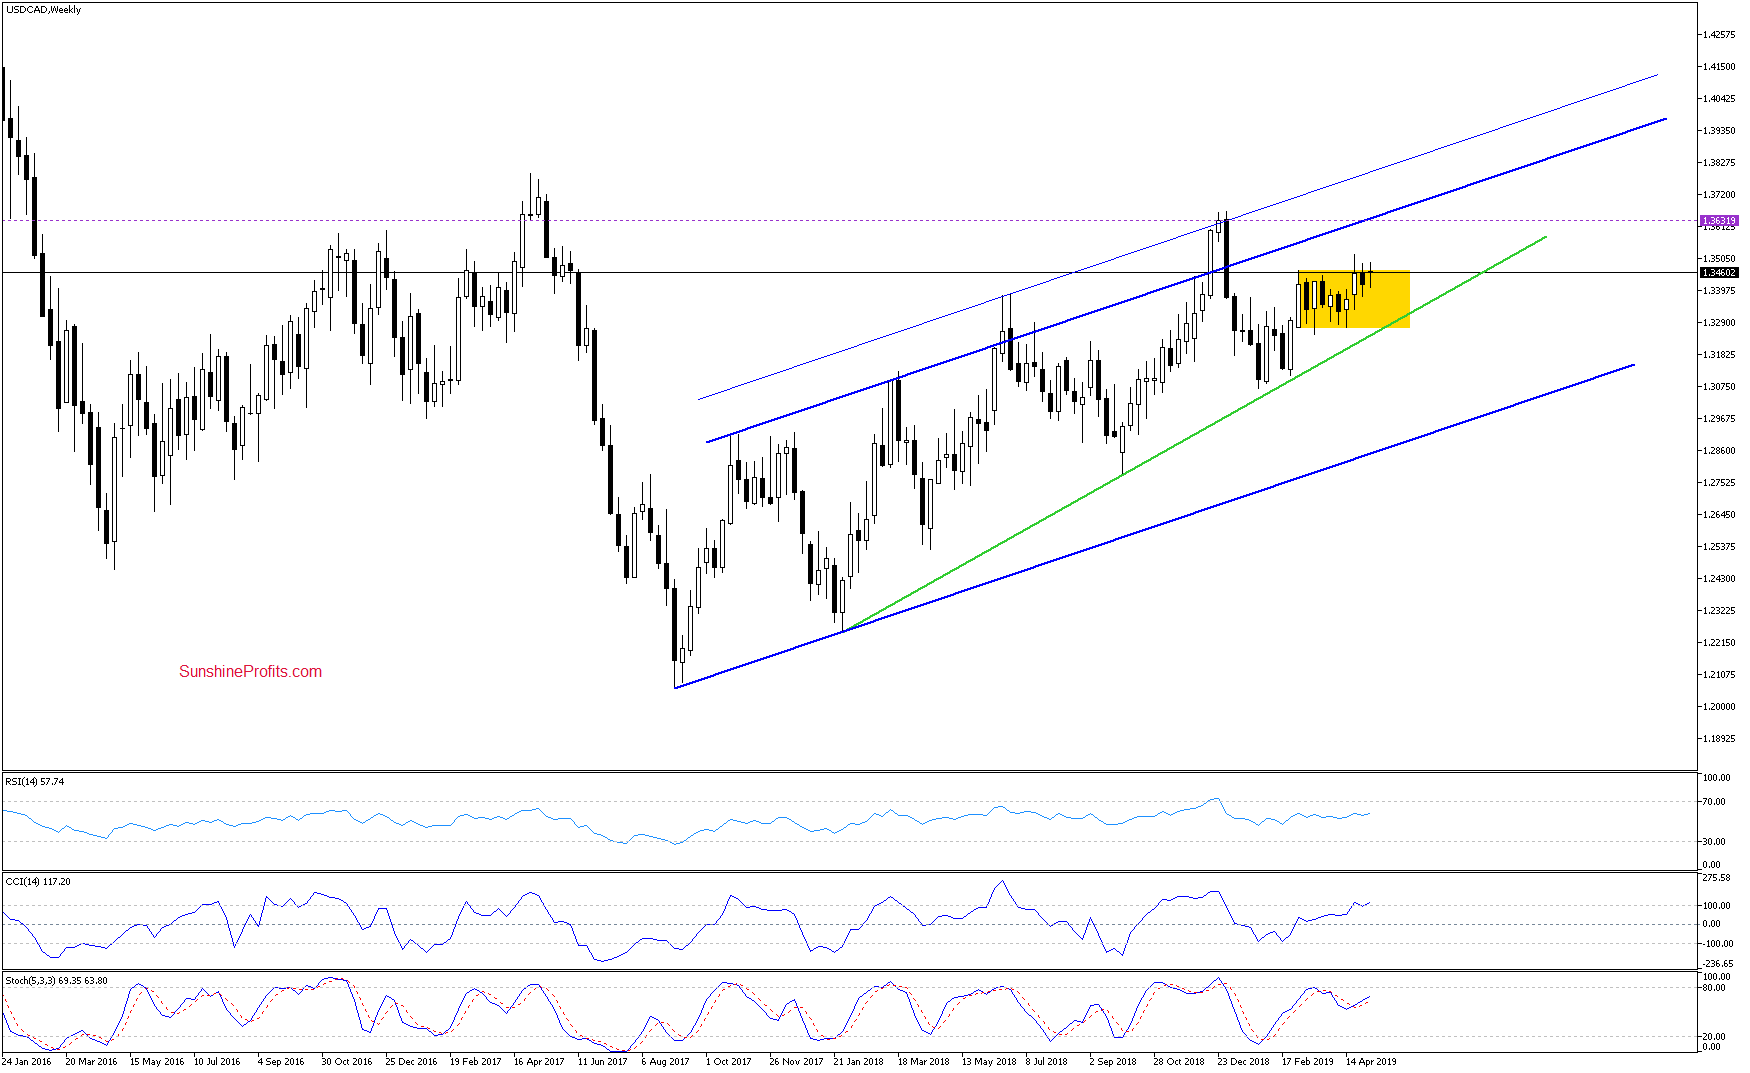
The weekly chart reveals that the bulls still have serious trouble overcoming the upper border of the yellow consolidation. It suggests that their last month's strength could be exhausted and the sideways trend on its last legs.
Should this is the case and we see more bearish signs such as another weekly close below the above-mentioned upper border of the yellow consolidation, we'll consider opening short positions.
AUD/USD: Taking a Breather or Basing?
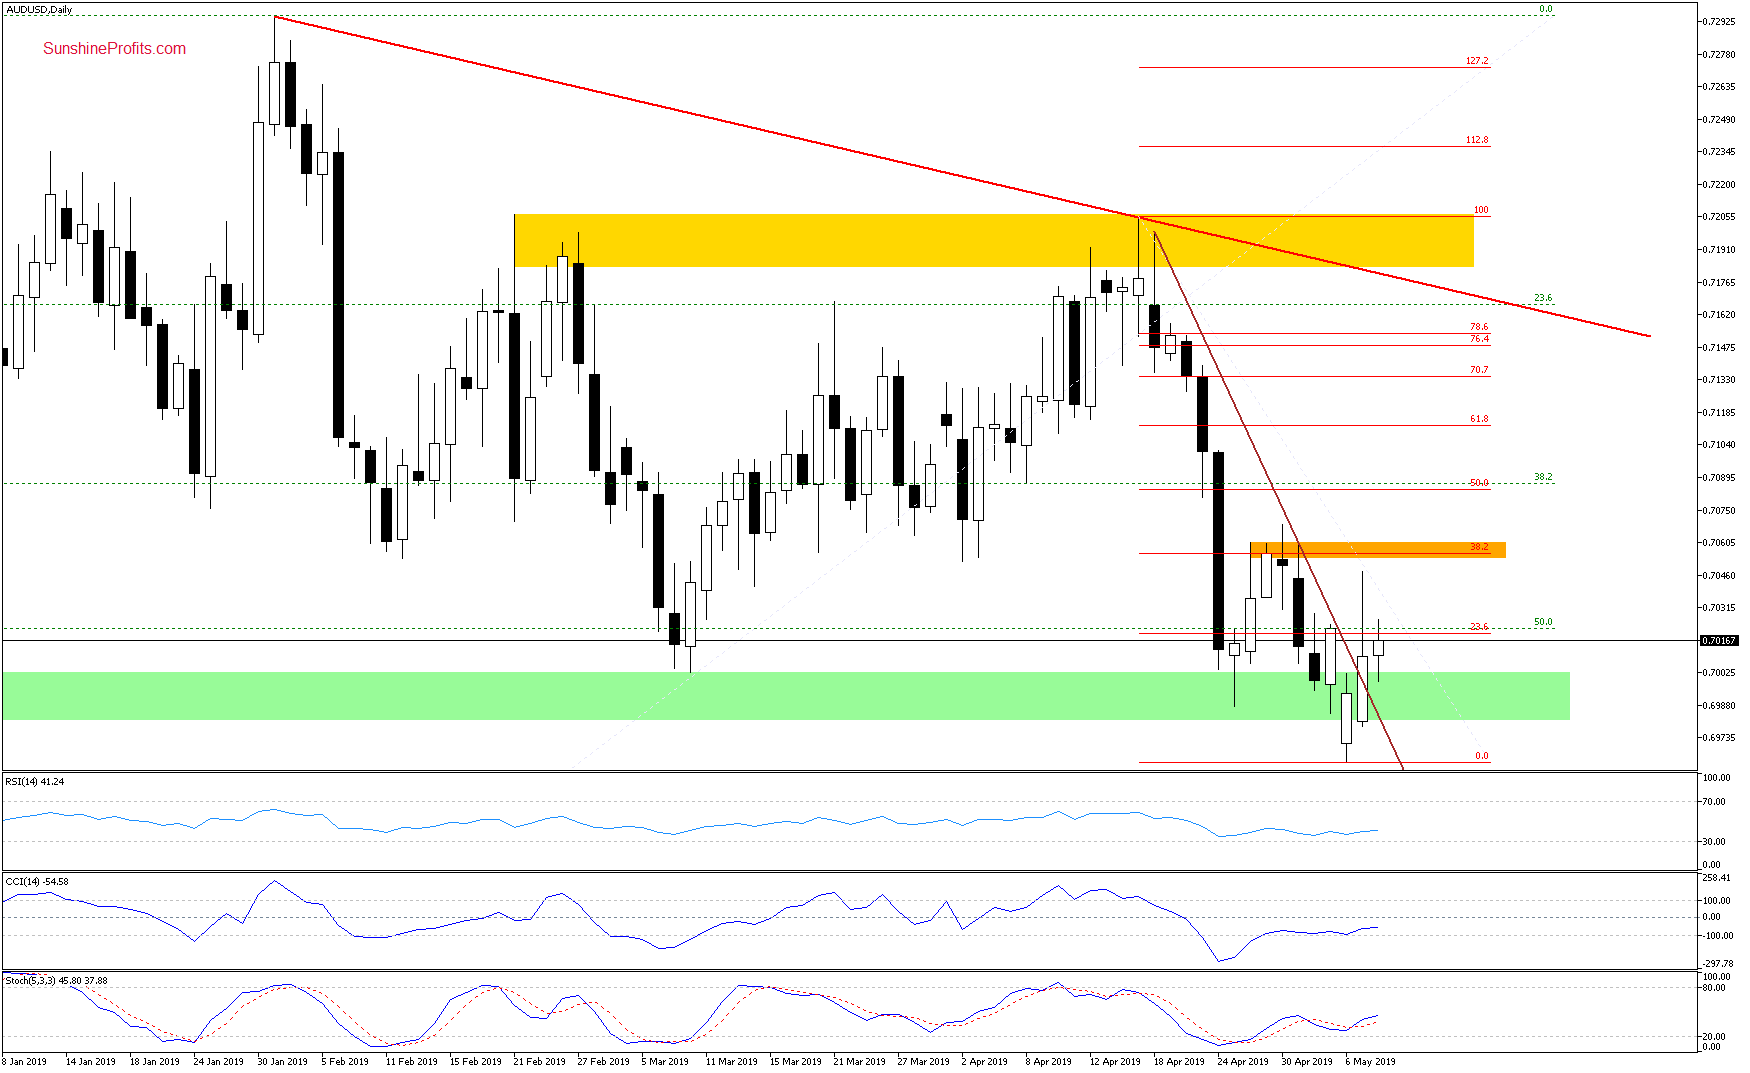
AUD/USD has moved sharply higher yesterday, breaking above the brown declining resistance line and the 23.6% Fibonacci retracement. The proximity to the orange resistance zone created by the previous peaks and the 38.2% Fibonacci retracement have stopped the bulls, however. They gave up much of their gains before the day was over.
Still, the pair has closed the day above the green support zone. This has facilitated another attempt to move higher earlier today yet that also looks to have failed as the pair trades at around 0.7005 as we speak.
It seems we're looking at a short-term situation with roughly balanced forces of the buyers and the sellers. Let's look for more clues in the daily indicators. They're leaning bullish and the Stochastics has just generated its buy signal. It looks like further improvement is just around the corner.
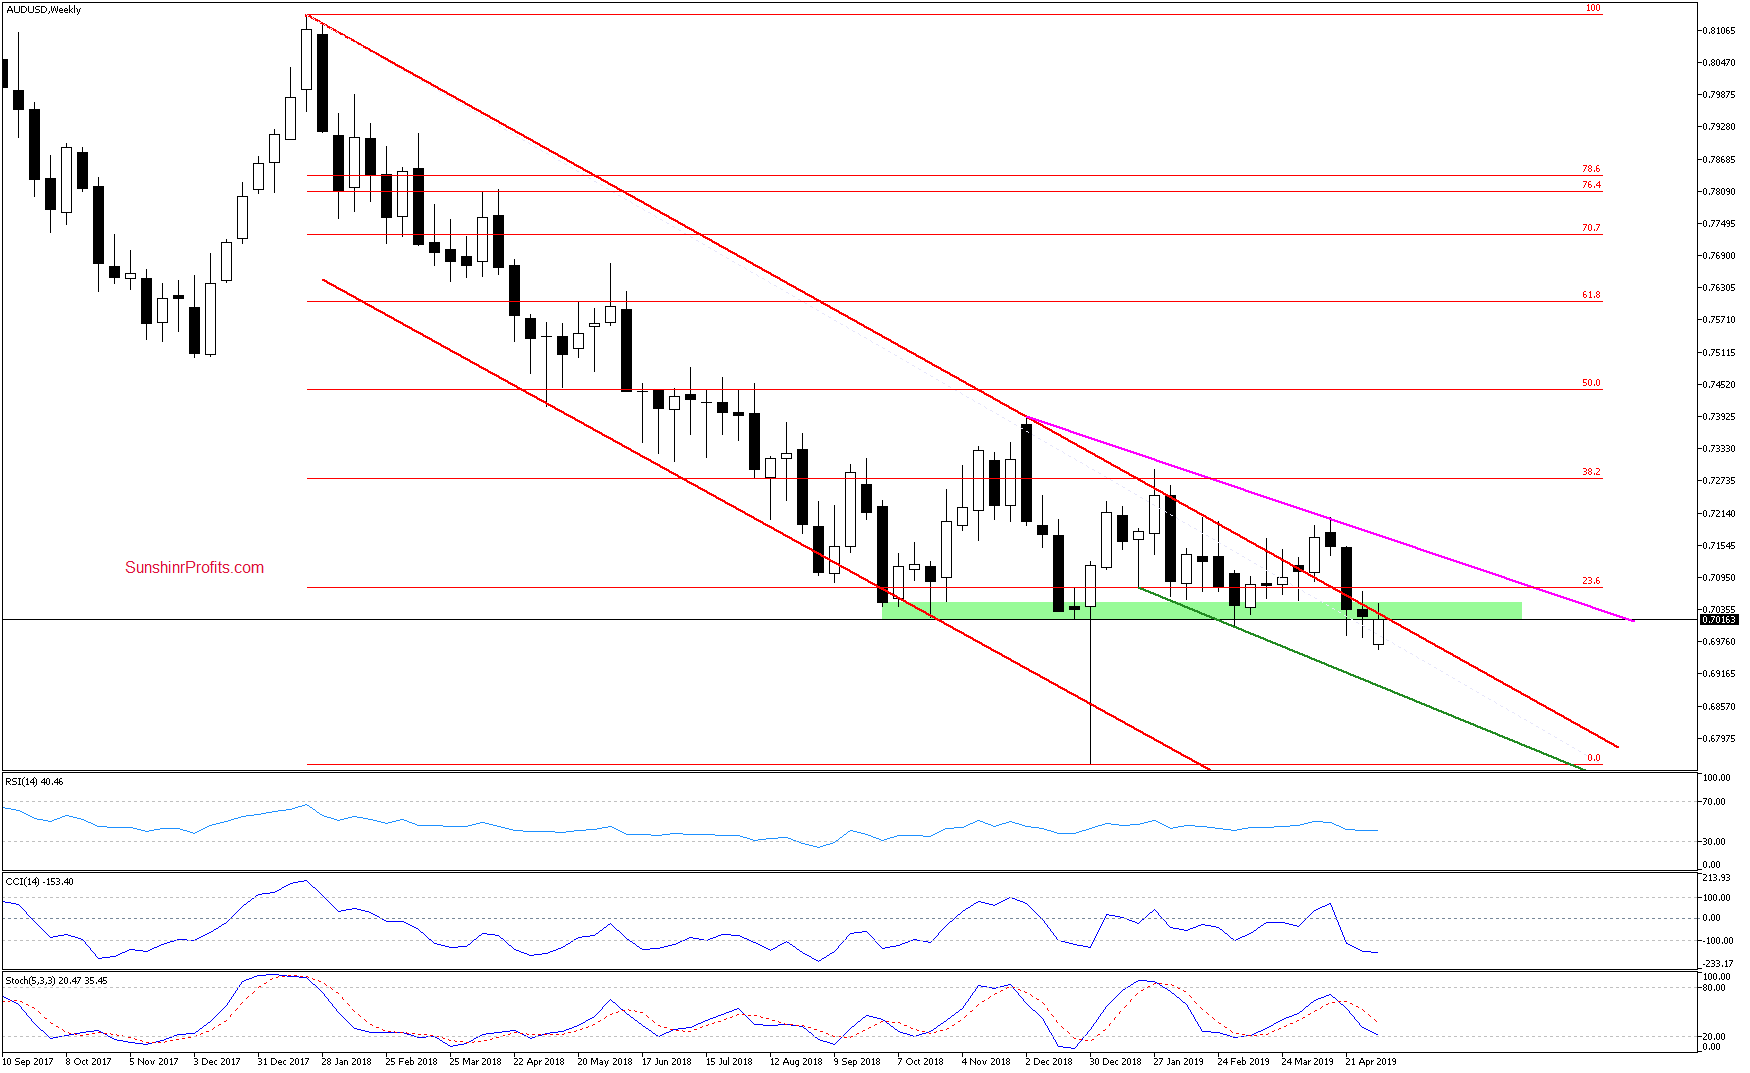
What obstacles do the bulls face on their journey north? Any meaningful upside move will be more likely and reliable only if the pair first breaks above the upper border of the declining red trend channel as seen on the weekly chart just below. Should we see such price action, we'll consider opening long positions.
Let us now provide you, our guest, with a rare peek under the hood. More precisely, into the summary that closes each Alert. It features a helpful overview of both positions and opportunities, distilling the actionable highlights of each day.
Summing up the Alert, the EUR/USD short-term outlook favors the bears but the situation is not strong enough to warrant opening a position. Capital, your capital, is too precious for this. When it comes to USD/CAD or AUD/USD, we're keeping a watchful eye on more bearish, respectively bullish signs emerging that would allow opening new position(s) with favorable risk-reward ratio(s). Apart from these, there're no other opportunities worth acting upon in the currencies. Patiently waiting for and acting on the strongest opportunities only is the name of the game. As always, our subscribers will be informed.
