Ten-year nominal rates continue to drift back towards the 2012 lows; the U.S. 10-Year Treasury yields only about 1.75% now. But 2015 is so very different than 2012 in terms of the cause of those low rates.
Nominal bonds are like the packaged sandwich you pick up at a gas station: no special orders. You get the meats in the proportions they were put on the sandwich; in the case of nominal bonds you get real yields plus inflation expectations and the nominal yield moves the same amount whether the cause is a change in real yields or a change in inflation expectations. If you buy nominal bonds because you think the economy is growing weak, and you’re right but at the same time inflation expectations rise, then you’re out of luck. You get what’s in the package.
If you look beyond the packaging, to what is making up that 10-year yield sandwich, then the difference between 2015 and 2012 is stark. When 10-year nominal yields were at 1.50% back in 2012, 10-year real yields were at -0.90% and 10-year inflation expectations were around 2.40%. The bond market was pricing in egregiously weak real growth for the next decade, coupled with fairly reasonable inflation expectations. TIPS were clearly expensive at the time, although I argued that they were less expensive than nominal bonds. (In fact, I may have said that they were expensive to everything except nominal bonds).
Today, on the other hand, nominal yields are low for a different reason. TIPS yields, while low, are positive (10-year real yields are 0.13% as I write this) but inflation expectations are very low. So, in contrast to the circumstance in 2012, we see TIPS as very cheap, rather than rich.
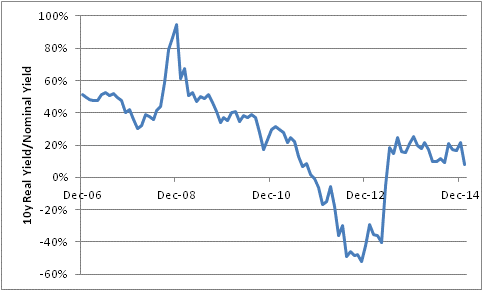
One way to look at this difference in circumstance is to study how the proportions of meats in the sandwich have changed over time. The chart below (source: Enduring Investments) shows the percentage of the nominal yield that is made up of real yields. The percentage which is made up of inflation expectations is approximately 100% minus this number, so one chart suffices. Back in “normal times,” real yields tended to make up 40-50% of nominal yields.

That 40-50% isn’t graven in stone; for example, we can say with some confidence that the ratio should be lower at very high nominal yields: if 10-year rates are at 20%, it isn’t because people expect real growth of 8%, but because inflation expectations are quite high. And another line of reasoning applies when nominal yields are very low, because inflation expectations tend to reach a floor. I mention this because I wouldn’t want someone to look at this chart and say “the ratio ought to get back to 40%, and it’s at 7% now, so TIPS are still very expensive.” In fact the relationship is considerably more complex, and as I said before we see TIPS as very cheap, not rich.
That being said, the point is that while nominal yields are similar now to what they were in 2012, the circumstances are quite different and your trading view of nominal bonds must take this into account. In 2012, to be bearish on nominal bonds you mainly had to be of the view that growth expectations were unlikely to get appreciably worse than the awful expectations which were embedded in the market. In 2015, to be bearish on nominal bonds you mainly have to be of the view that inflation expectations are unlikely to get appreciably lower.
Yesterday the Federal Reserve acknowledged that they are concerned with the state of inflation expectations. In the statement following yesterday’s meeting the FOMC noted that “Market-based measures of inflation compensation have declined substantially in recent months” and they repeatedly noted that they need not only inflation but also expectations to move back towards their long-term targets before they start to think about nudging interest rates higher.
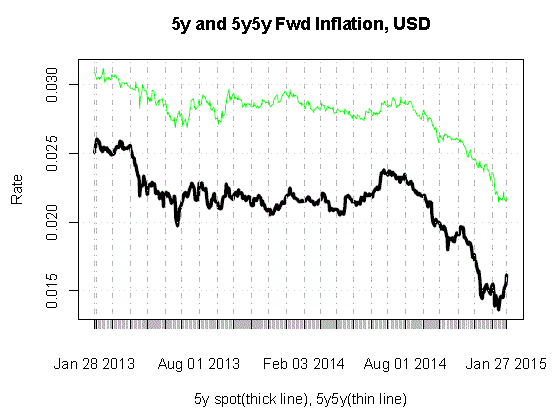
It is certainly convenient since median CPI is at 2.2%, which is fairly consistent with where they perceive their target to be. But this is a dovish Fed and they’re not looking anxiously to tighten. Ergo, inflation expectations are now their focus. Beyond that, you can expect them to focus on the 5-year forward expectations once spot expectations rise (see chart below, source Enduring Investments, showing 5-y and 5y5y forward inflation from CPI swaps).

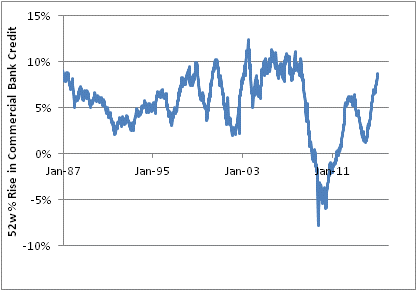
This is all good for restraining velocity, since lower rates tend to keep money velocity low…except that velocity is already lower than it should be, for this level of rates! And so we come to the last chart of the day: corporate credit growth. To the extent that some part of the decline in money velocity was due to the impairment of banks’ ability to offer credit, this seems to no longer be an issue.
Commercial bank credit is up at an 8.7% pace over the last year (11.1% annualized over the last 13 weeks), which looks to be back to normal…if not on the high side of normal.

So, as far as sandwich meats go, the Fed is focusing on a bunch of baloney. There are plenty of reasons to hike rates right now, if they wanted to. They don’t. (Moreover, as I have pointed out before: hiking rates will actually push inflation higher, unless they arrest money growth…which they have little ability to do right now).
