
What happens to the global markets when the U.S. Fed begins to weaken stimulus activity and when the global markets must begin to function on their own? Are the global markets capable of sustaining current price levels without the Fed supporting them?
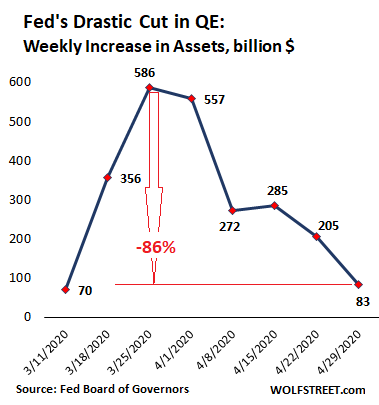
A recent news article suggests the U.S. Fed has drastically slashed stimulus activity over the past 5+ days. From a peak level of nearly $600 billion a week to current levels near $83 billion per week – an 86% decrease. How will this reflect in the market's ability to sustain current price levels in the face of disastrous Q2 expectations? Yup, markets are falling fast and hard going into the weekend as expected.
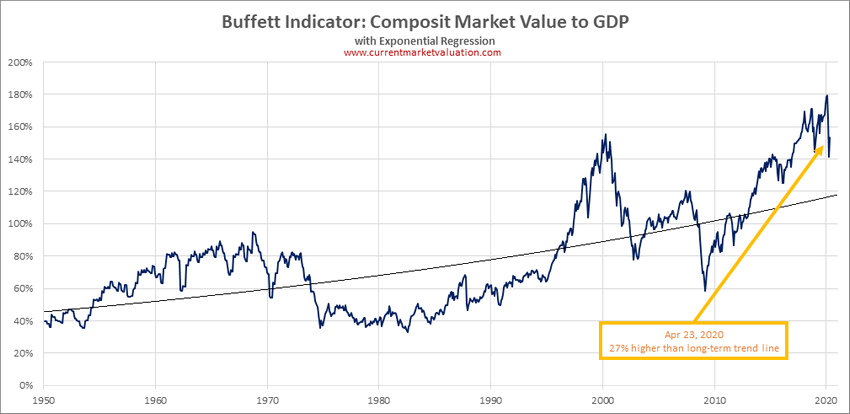
Buffet Indicator
Another common tool for skilled traders is the Buffet Indicator, which helps us understand stock market valuation levels and measures extreme trends by measuring Standard Deviation ranges.
Currently, the Buffet Indicator is near the highest levels ever recorded over the past 60+ years. Additionally, a “detrended” version of the Buffet Indicator suggests a broader global recession would require a further
devaluation before a true bottom is likely to complete.
This first Buffet Indicator chart shows the current market value to GDP and highlights the recent peak as being the highest level ever recorded. Notice how this level is much higher than the peak in 2000. This indicates that the stock market valuation level is excessive compared with historical norms.
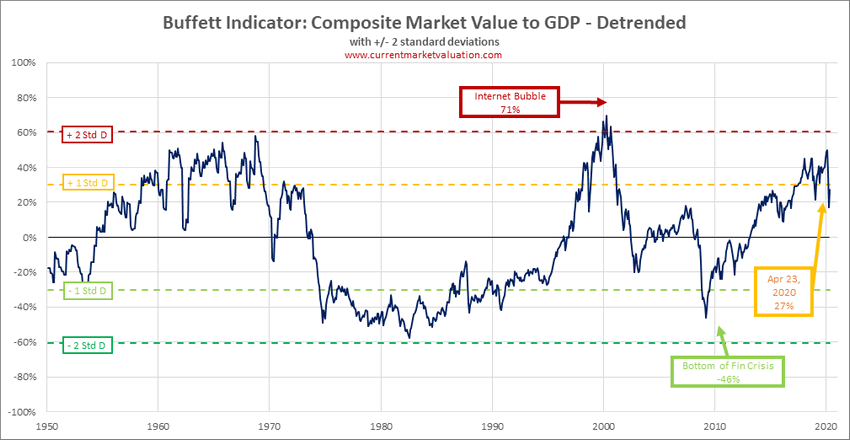
Detrended Buffet Indicator
This Detrended Buffet Indicator suggests the recent peak may not reflect the same excessive valuation levels as we experienced in 2000, yet are historically near the upper range of extended valuation levels. Notice how price devalues as a process of setting up a valuation advance throughout time.
When prices become overvalued (think of simple supply/demand theory), demand typically collapses – sending prices lower. At this time, we have the global COVID-19 virus event disrupting the demand-side
of this equation. When demand collapses, where do prices go?
Our research team believes the current trend will eventually end, and global stock market prices will collapse again as a much deeper price low/bottom sets up. Skilled traders need to understand that as long a the U.S. Fed was pouring $600 billion a week into the credit/stock market, the recovery in price was going to be substantial. Once that stimulus ends, and the markets are left to function on their own, the aspects of the demand collapse become more evident.
In a way, the Fed acted as a “demand supplement” for the U.S. and global markets. Buying up assets and supporting the credit markets in an effort to transition us past the crisis event that took place in late
February and March 2020. How quickly will the global markets transition back into a declining mode?
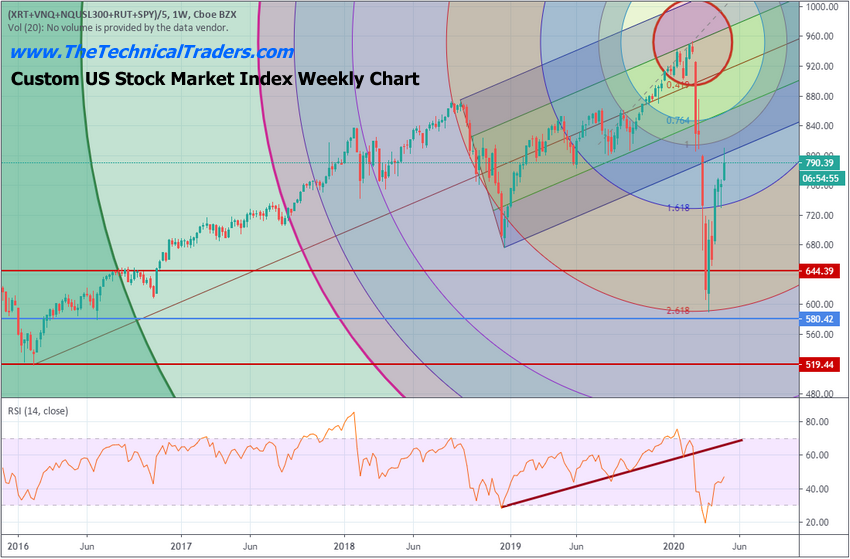
Custom U.S. Stock Market Index - Weekly Index
Our original targets where price may attempt to form a deeper bottom near the 2015~2016 price range is still very valid. Near the peak of the recent selloff, price levels reached these predicted levels just before the U.S. Fed began the stimulus programs. Now, price levels are nearly 35%+ above these low price levels.
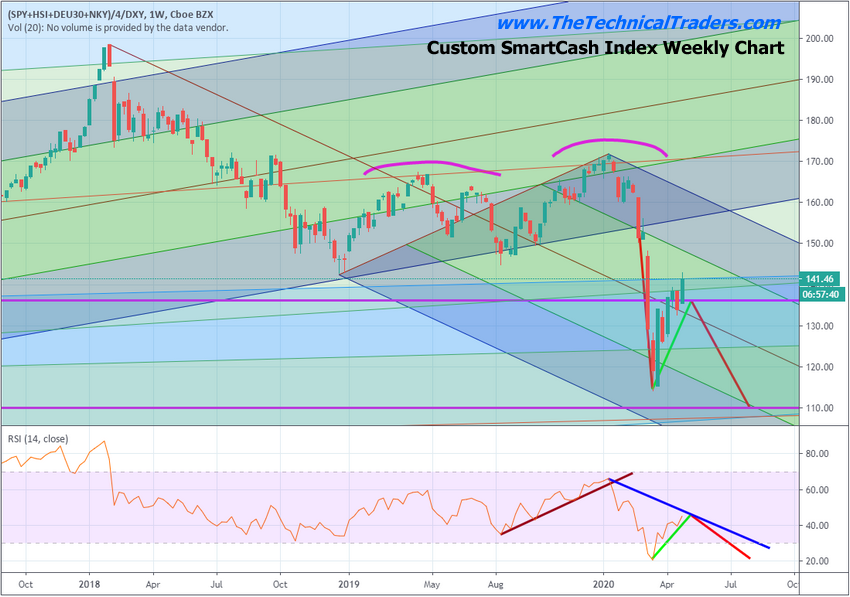
Custom SmartCash Index - Weekly Chart
It seems obvious to our research team that continued lack of consumer demand and lack of central bank intervention will likely result in the U.S. stock market moving lower in the near future and attempting to
establish a true price bottom. We believe that bottom will likely happen near July or August 2020 and will likely reach levels near, or below, the 2015~2016 price range but this analysis will change as we progress forward with new events and analysis.
You can see our predicted price bottom on this Weekly Smart Cash Index chart. The lines we've drawn into the future show where we believe the first attempt at a true price bottom may take place near July
or August 2020.
Concluding Thoughts:
Remember, this type of price rotation is very healthy for the U.S. and global markets. The price must rotate through these types of trends to eliminate excessive risk/froth and to secure a proper price equilibrium where valuation levels can begin to appreciate again. This process is almost cathartic in a sense. The ability to regain a “true valuation base/bottom” in price (consider Fibonacci Price Theory)
allows the future appreciation cycle to function more efficiently (having eliminated excessive risk valuations).
We will get through this and the global economy will continue to function. We just have to get through the next 6+ months and the relative economic disaster of Q2 and Q3 (likely) before we're going to see
any real chance at true price appreciation.
At this point, when the Fed-induced upside trend breaks – watch out below.