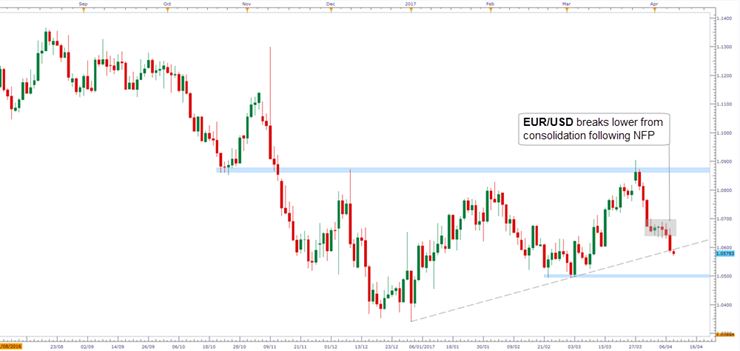
EUR/USD spent the majority of last week oscillating within a 50 point range before breaking decisively lower on Friday’s US jobs data.
The intense period of consolidation that preceded Friday’s sell-off is significant because it increases the probability of continued selling pressure.
We certainly see scope for a press down into the 1.0500 marker.

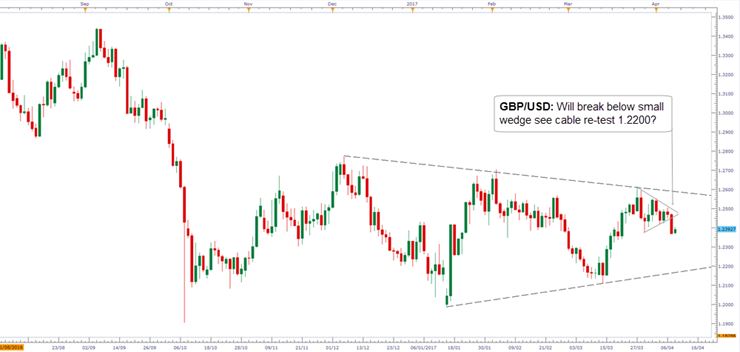
Cables technical structure is a case of wedges within wedges!
Friday’s dollar strength saw cable break lower from a small wedge, which had formed at the top of a much larger wedge.
Price behavior within wedges are by definition highly random so we’re not getting too carried away with pretty patterns we’ve drawn on cables price chart. We can however use the knowledge that short-term momentum is bearish on the daily candle chart to look for short setups on lower time frames.

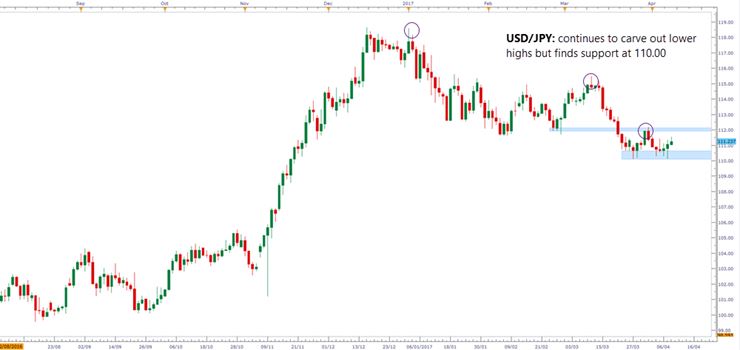
Both yen and the greenback were dominating our relative strength charts last week so it comes as no surprise to see USD/JPY treading water in relative equilibrium.
Whilst it’s clear that the market has found a foothold at 110.00 it is unlikely that this will be the springboard used to break the 112.00 resistance barrier.
For now we will look to play dollar and yen strength elsewhere.

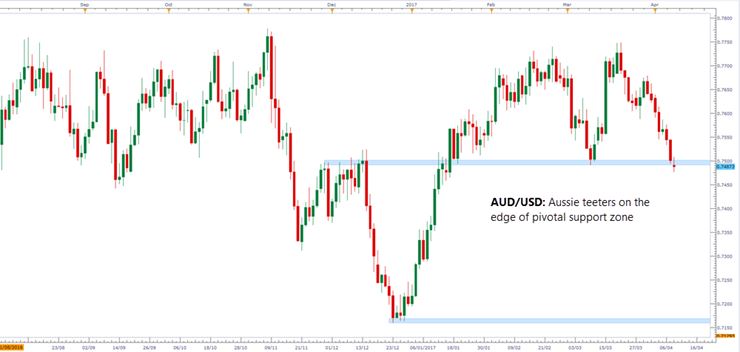
AUD/USD’s mid-March test of 0.7750 resistance seems like a distant memory with the market now teetering on support at 0.7490.
This support zone represents something of a last chance saloon for the Aussie as there’s a 300 point pocket of air below it.
Our knowledge of price behavior around key structural levels tells us that the best trade signals will come from false breaks. This will be in the forefront of our minds this week as a stop hunting plunge followed by a sharp reversal could create a fantastic buy signal.

