Cable Continues To Languish At The Bottom Of The Relative Strength List

Published 02/07/2017, 12:26 AM

EUR/USD

Having threatened to break its ascending trendline last Monday, EUR/USD fought back to put in in its highest close in over two months.

The higher close and new swing low may have repainted the ascending trendline and horizontal resistance zone but it does little to change EUR/USD’s core market structure. This is a market which is being squeezed into a critical area of resistance.

Given that market squeezes are typically filled with randomness it’s likely that the best trading opportunities will come from playing the peripheries of the pattern. Buying bullish rejections of the ascending trendline and selling signs of exhaustion within the resistance zone are all viable options this week.
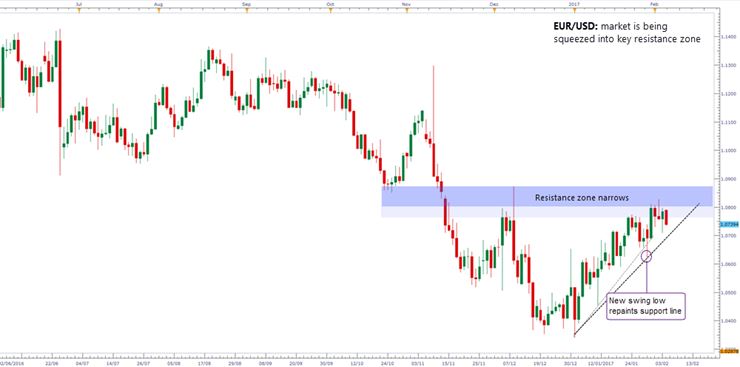
EUR/USD Daily Chart

GBP/USD

Cable continues to languish at the bottom of the relative strength list as last Thursday’s BoE policy statement knocked the stuffing out the market.

The 1.2400 marker remains a key area of short-term support. How prices respond to this level will likely set the tone for the week.

We’ll be keeping an eye out for lower timeframe bullish reversal patterns within the support zone whilst keeping in mind that a break and close below 1.2400 could trigger a much sharper sell-off.
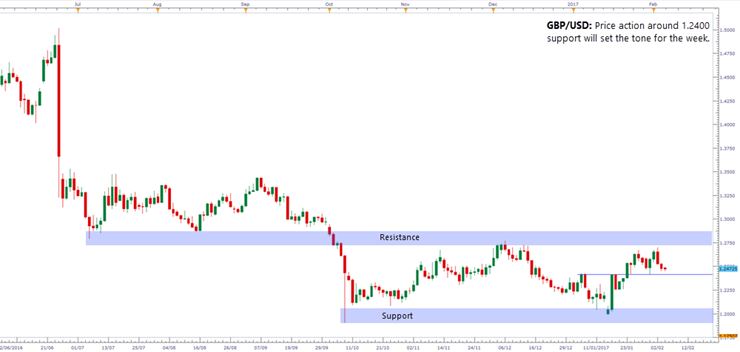
GBP/USD Daily Chart

USD/JPY

USD/JPY failed miserably to reignite its uptrend last week despite the BoJ defending its yield targeting regime.

The market is holding onto support at 112.50-112.00 by the skin of its teeth as any rallies are being beaten lower by dollar bears. Friday’s trading range was the narrowest in over four sessions so there’s plenty of scope for intra-day movement. Buying into any decisive break below 112.00 is likely to prove foolish.
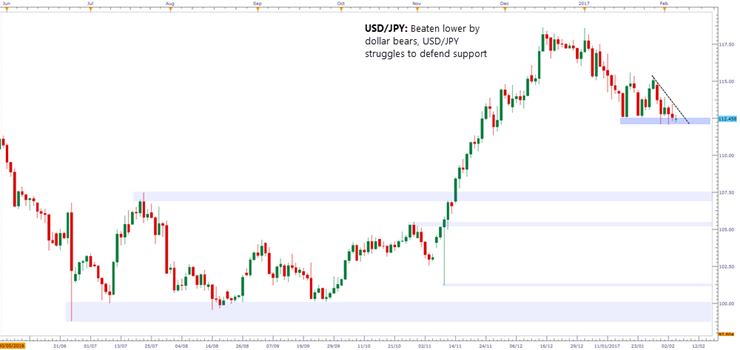
USD/JPY Daily Chart

AUD/USD

The Aussie was the star of the show last week as the market marched higher from a series of inside days.

Friday’s price action formed yet another inside day but we don’t expect it to have the same ‘springboard’ effect as last weeks. There’s a number of reasons for this conclusion including the size of the candle’s range, the size of the candles body and the RBA’s rate decision overnight.

We do however remain bullish on the Aussie and expect any retracements in to 0.7600 to attract fresh buying appetite.
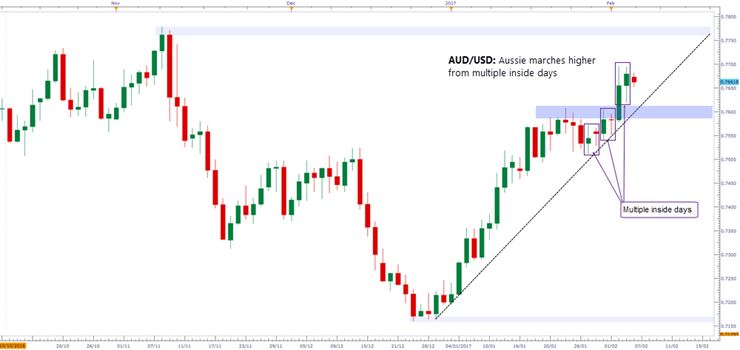
AUD/USD Daily Chart

Original post

Latest comments

Loading next article…
Risk Disclosure: Trading in financial instruments and/or cryptocurrencies involves high risks including the risk of losing some, or all, of your investment amount, and may not be suitable for all investors. Prices of cryptocurrencies are extremely volatile and may be affected by external factors such as financial, regulatory or political events. Trading on margin increases the financial risks.
Before deciding to trade in financial instrument or cryptocurrencies you should be fully informed of the risks and costs associated with trading the financial markets, carefully consider your investment objectives, level of experience, and risk appetite, and seek professional advice where needed.
Fusion Media would like to remind you that the data contained in this website is not necessarily real-time nor accurate. The data and prices on the website are not necessarily provided by any market or exchange, but may be provided by market makers, and so prices may not be accurate and may differ from the actual price at any given market, meaning prices are indicative and not appropriate for trading purposes. Fusion Media and any provider of the data contained in this website will not accept liability for any loss or damage as a result of your trading, or your reliance on the information contained within this website.
It is prohibited to use, store, reproduce, display, modify, transmit or distribute the data contained in this website without the explicit prior written permission of Fusion Media and/or the data provider. All intellectual property rights are reserved by the providers and/or the exchange providing the data contained in this website.
Fusion Media may be compensated by the advertisers that appear on the website, based on your interaction with the advertisements or advertisers.
© 2007-2025 - Fusion Media Limited. All Rights Reserved.