This week sees markets face the sobering reality of last year’s key political decisions.
Theresa May talks ‘hard Brexit’ tomorrow and Donald Trump is sworn into the White House on Friday.
When you throw a Mario Draghi statement and Chinese GDP into the mix it’s safe to say that we’re in for a bumpy ride!
Event risk brings with it bags of intra-day opportunity but only for those disciplined enough to have a plan and follow it. Let's take a look at how the major pairs are shaping up.
With cable’s collapse grabbing all of the headlines EUR/USD is flying somewhat under the radar.
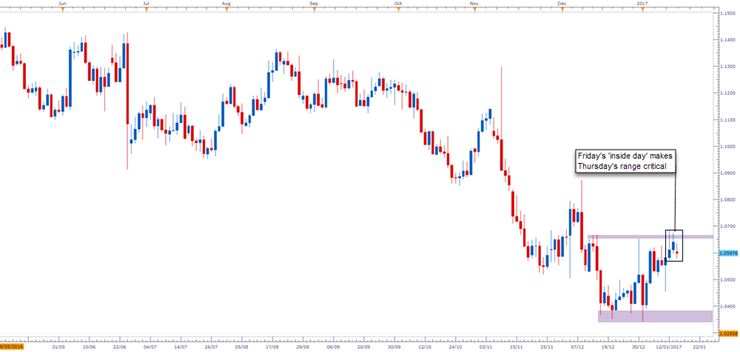
It's New Year rally appears to be running out of steam with the market rejecting 1.0654 resistance in each of the last two sessions.
Friday’s price action was contained within Thursday’s range, forming an ‘inside day’. It is this consolidation pattern which forms the basis of our EUR/USD strategy this week.
A break and close below Thursday’s low at 1.0571 is likely to confirm that a new top is in place. We would then look to sell lower timeframe consolidations.
EUR/USD Daily Candle Chart:

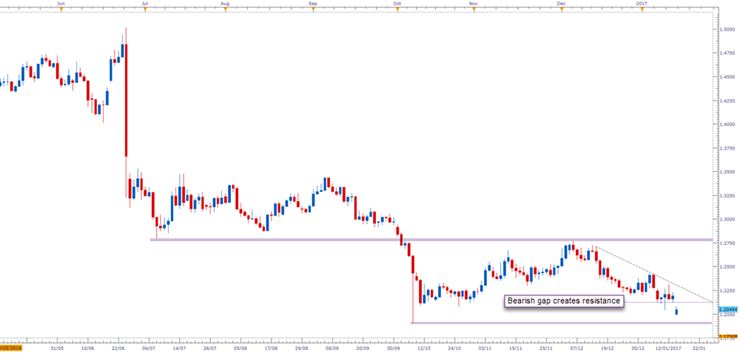
This morning’s brutal gap lower on virtually zero news highlights how tense the market is ahead of May’s speech tomorrow.
It comes as no surprise to see sterling’s one-month implied volatility hit a two-month high.
For those brave enough to dip a toe into this market, an intra-day ‘gap fill’ trade is a distinct possibility. However, we expect the top of the gap (Friday’s low at 1.2121) to cap any upside prior to May briefing the market.
GBP/USD Daily Candle Chart:

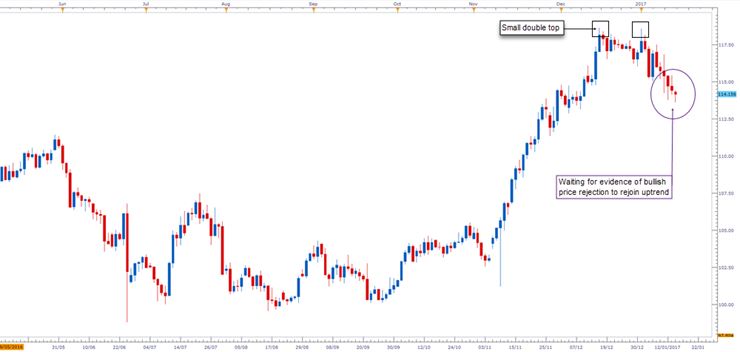
The poster boy of the Trump ‘reflation trade’ has lost some of its shine in recent weeks, undergoing a 400 point retracement from its double top highs at 118.60.
This retracement should be seen as a healthy dose of mean reversion within a strong uptrend. In other words, the pullback from highs will likely create an attractive buying opportunity for those patient enough to time their run.
For now we’re looking for clear evidence that USD/JPY’s retracement phase has come to an end. This means lower timeframe selling capitulation, wide range ‘key reversal’ session or a series of positive closes.
Perhaps Trump’s inauguration on Friday will be the catalyst to reignite this reflation trade!
USD/JPY Daily Candle Chart:

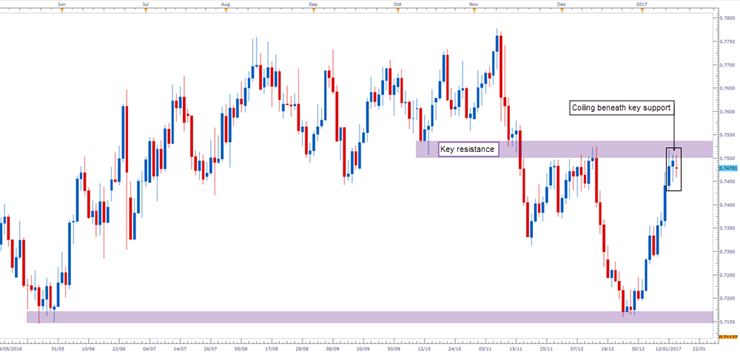
The Aussie was the star of the show last week. Buoyed by stronger metal prices the market continued its spectacular V-shaped recovery from the 0.7150 support zone.
After such a swift ascent, the market is now taking a pause for breath as Aussie bulls prepare to challenge the 0.7500 marker. We can see from the daily candle chart that 0.7500 has been used as both support and resistance during the last two months and this adds to its significance.
Friday’s price action saw the market coil beneath the resistance zone, forming a small ‘inside day’ in the process. Given the strength of the Aussie’s short-term momentum, probabilities favour upside continuation. However, we remain on guard for ‘fake breakouts’ and short squeezes in and around the 0.7500 zone.
AUD/USD Daily Candle Chart:

