In this mini-series, I am reviewing the seven most important stocks of the current market (Facebook (NASDAQ:FB), Apple (NASDAQ:AAPL), Netflix (NASDAQ:NFLX), Alphabet (NASDAQ:GOOGL), Microsoft (NASDAQ:MSFT), Amazon.com (NASDAQ:AMZN) and NVIDIA (NASDAQ:NVDA)). I am halfway through the list and have assessed in descending market-cap order using Elliott Wave Theory (EWT).
See my articles here:
– Apple
– Microsoft
– Amazon
– Alphabet
Today it is Facebook’s turn. With a market cap of $638 billion, it is next in line by descending order.
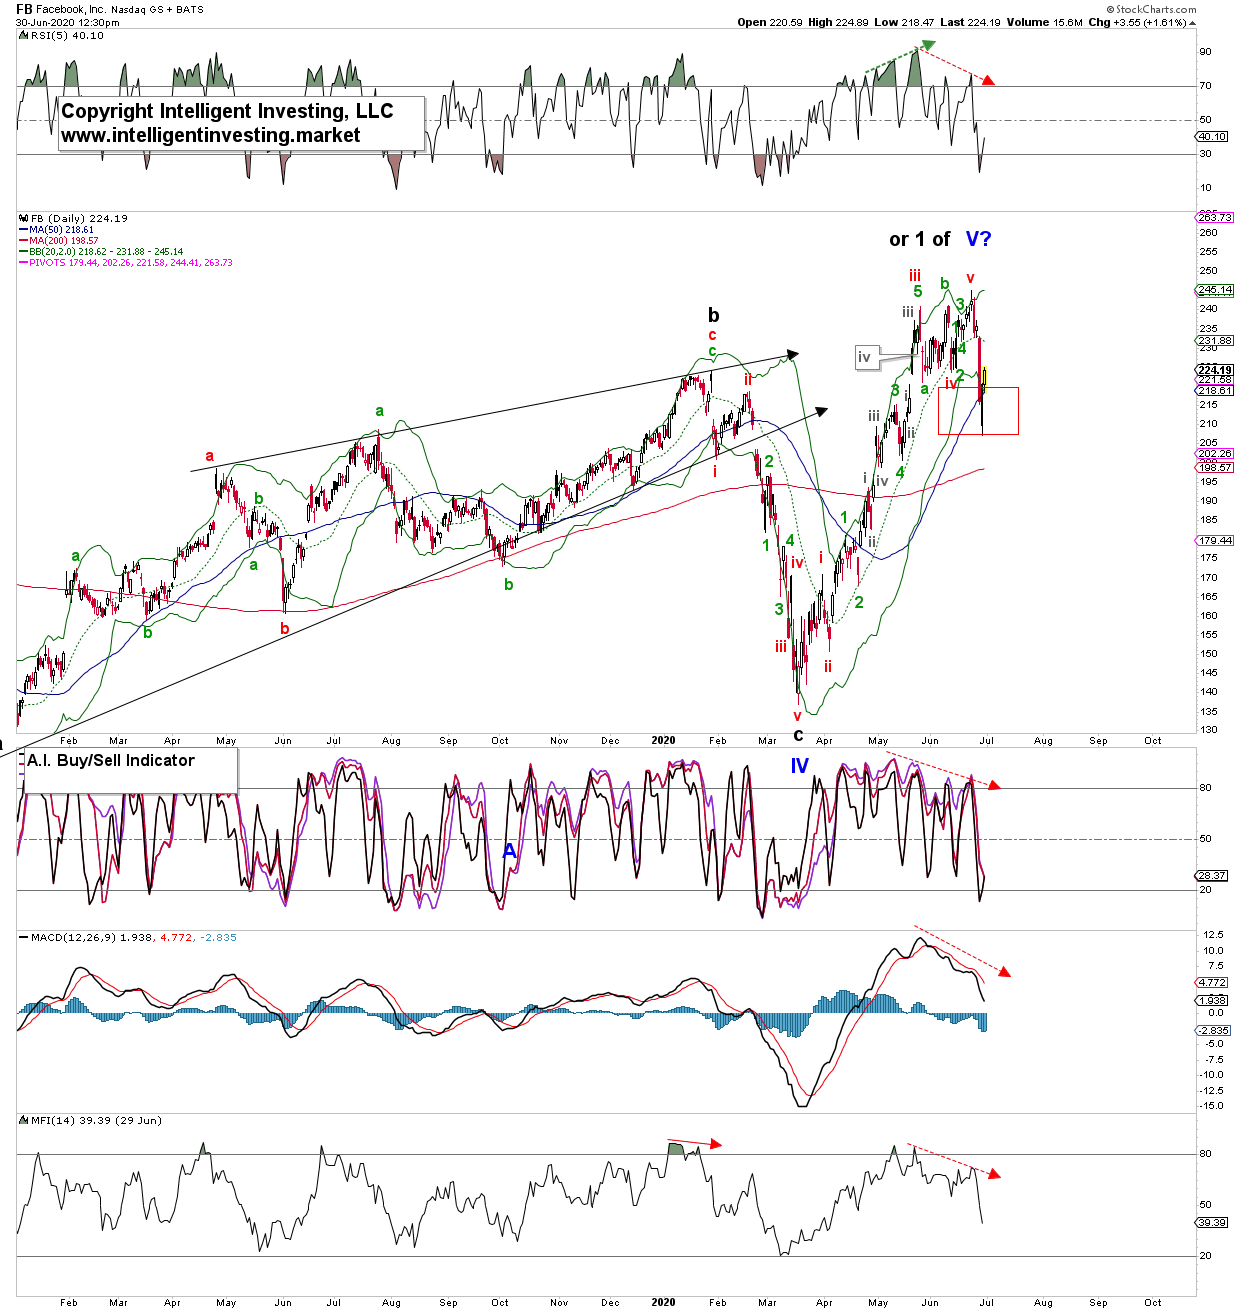
Starting with the daily chart, see Figure 1 below, I can count five waves up off the infamous March 23 low. At yesterday’s low, Facebook had lost 16% of its value in a matter of a few days, quite a significant drop. The stock is now staging an oversold rebound. Price bottomed right in my ideal target zone and could quickly move back to $235 before moving lower again. Note the negative divergences on the technical indicators over the last month (red dotted arrows). Although divergence is only divergence until it is not, it must always be noted, as it clearly can foretell of fast downside moves. Ignore at one’s peril.
Figure 1:

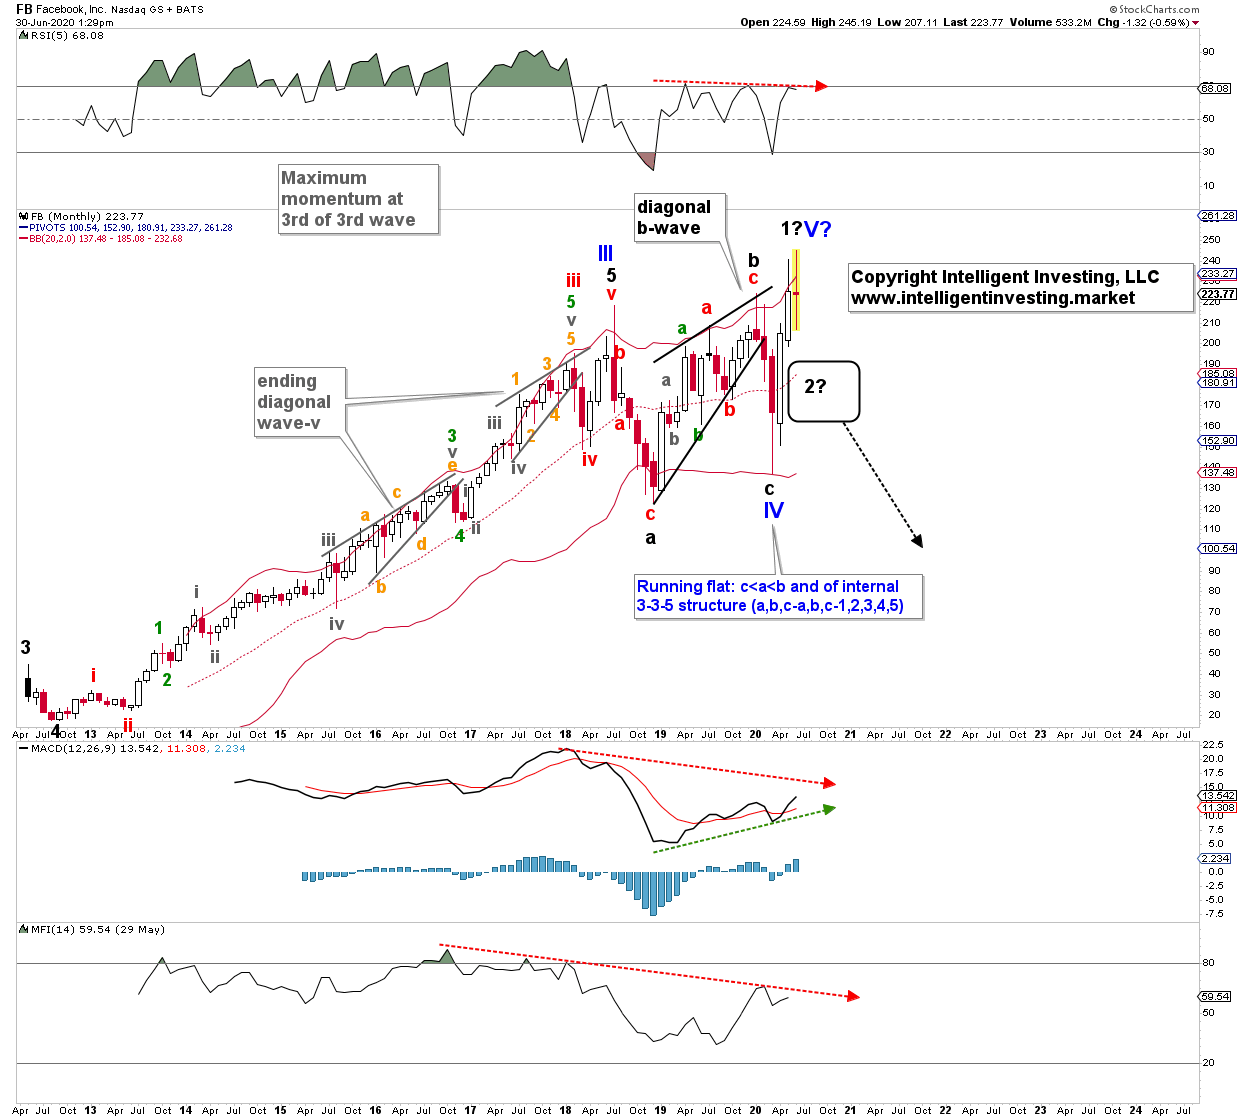
Zooming out, I count the rally in 2019 as a large diagonal (black) b-wave of an even larger (blue) Primary-IV wave, which bottomed on, yes, you guessed it right, March 23. The (black) c-wave of wave-IV was a picture-perfect five (red i, ii, iii, iv, v) waves down. And red (intermediate) wave-iii subdivided in five green (minor) waves: 1, 2, 3, 4, 5. Picture-perfect, too. Elliot wave at its best. This entire price structure is part of a large running flat and better shown using the monthly chart. See Figure 2 below.

Here I count Facebook’s Initial Public Offering (IPO) as (black) major wave-3 and its subsequent low as wave-4. Companies issue an IPO when they have reached the end of a specific business cycle. That high can be a 1 st wave or a 3 rd wave. Many companies flare after an IPO, only to fizzle out. Think of GoPro (NASDAQ:GPRO), Fitbit (NYSE:FIT), Uber (NYSE:UBER), etc. Facebook did quite the opposite, and why I prefer to label the initial price action somewhat differently than you would see done by many others.
Regardless, since the summer of 2012, Facebook went on a tear as it completely dominated the social media space. In large part by acquiring Instagram, Oculus, WhatsApp, among others. It counts beautifully as five waves up into the summer of 2018 high.
Since then, due to the reaction to mostly earnings, Facebook has essentially been in a sideways pattern for 18 months ($219-> $123-> $224-> $137) before it finally moved higher to its recent ATH of $245. Note the words “reaction to” because it is sentiment that drives most stocks. Even bad earnings can be perceived as good. Thus, since the $219 high in July 2018, Facebook gained $18/share over 23 months (8%). Not an impressive number considering it increased $93/share over the 23 months before July 2018 (74%). Something to consider from a long-term investment point of view.
If you have read my previous articles about Apple, Amazon, Alphabet and Microsoft, you will recognize the same pattern for Facebook as for those stocks: Big rally, sideways consolidation for many months, followed by
another rally. Meanwhile, all the technical indicators are negatively diverging on the monthly timeframe. See red dotted arrows in Figure 2. This pattern keeps re-occurring because it is a reflection of human/investor sentiment, which doesn’t change. EWT qualifies and quantifies sentiment with its waves. This pattern means Facebook is most likely in its final move, i.e., Elliot wave, higher like these other stocks. Less and less money is flowing into Facebook at these ever-higher prices.
Eventually, this can be dangerous because liquidity is a significant driver. Just refer to figure 1 to see what negative divergences on the daily time frame did: a 16% haircut in a few days. It is, therefore, not difficult to imagine what
such divergences on a 20x longer time-frame (one month contains, on average, twenty trading days) could do.
For now, the bulls’ only hope is, IMHO, that the recent rally off the March low was only wave-1 of V. Facebook will then still undergo a sizeable correction for a wave-2 down to ideally the $160-190 zone, before the next rally (wave-3) to the high-300s, low-400s gets underway. But, a move and close below critical support at $160 will most likely mean Facebook has topped long-term and should make its way back down to around $70+/-10 before the next upcycle starts.
