Markets were acting decent after the Federal reserve came out Wednesday and said nothing new.
Some stocks are still doing fine and I did do some buying in the week past but I’m not heavy by any means.
We’ve seen dips be bought and rallies sold for sometime now and I’d certainly expect that type of action this summer so it should be an easy summer to take some time off.
That said, if markets and stocks do begin to move with heavy volume I’ll be focused and heavy into stocks.
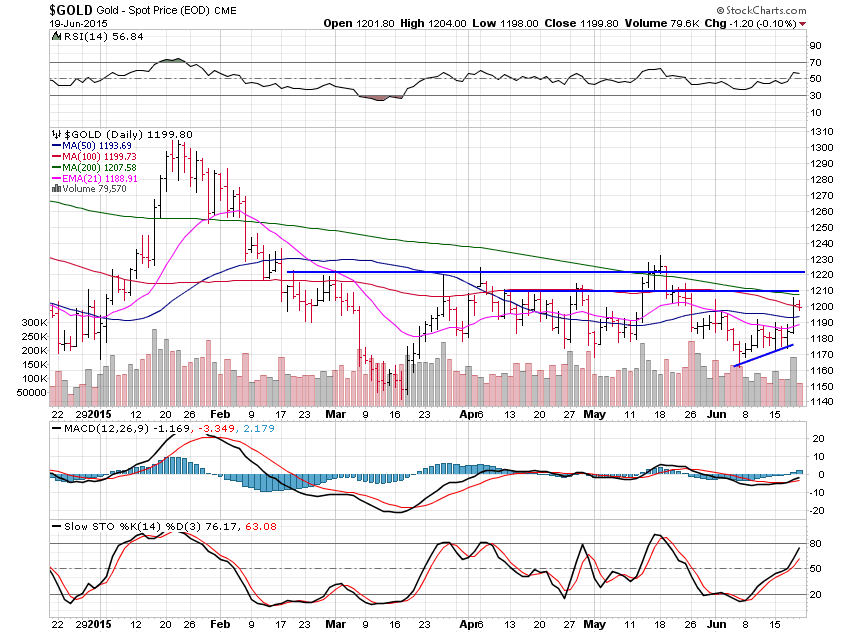
Gold was just about to roll over but then rallied well Thursday but it is up against formidable resistance and any of these sharp moves higher have been met with selling so I have to look for the same this time.

Gold gained 1.63% this past week but that all came on Thursday.
As often happens, which is evidenced by the gaps on the GLD chart, gold moved in overseas action Thursday.
Gold is up against strong resistance at $1,210 and $1,220 which it hasn’t been able to best since February.
The dominant trend remains lower and only a move above $1,220 on extraordinarily high volume would change the chart in that manner.
Gold can be shorted into strength, or on a break under $1,190.

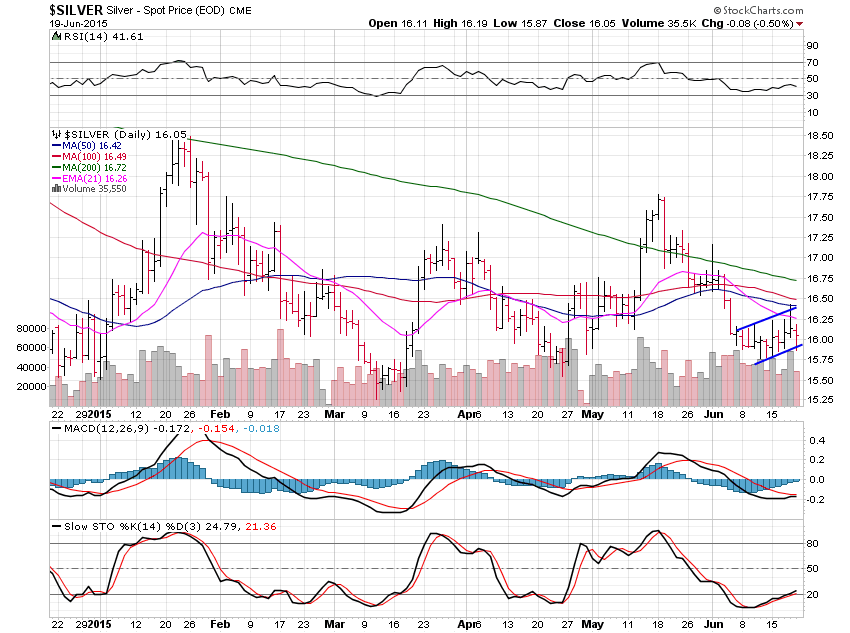
Silver gained 0.78% this past week but looks very weak.
Silver is in a bear flag here and is acting much weaker than gold, having closed near the lows after a strong start to Thursday.
Friday saw silver roll back to the low end of this bear flag and it looks ready to break the $15.90 area which could be shorted.
Summer is here and the metals look weak and, as I talked more in depth about last weekend, a move much lower would be most constructive for the chart and actually allow the metals to setup to move higher over time since the charts are not at all setup to allow gold and silver to move up from here.

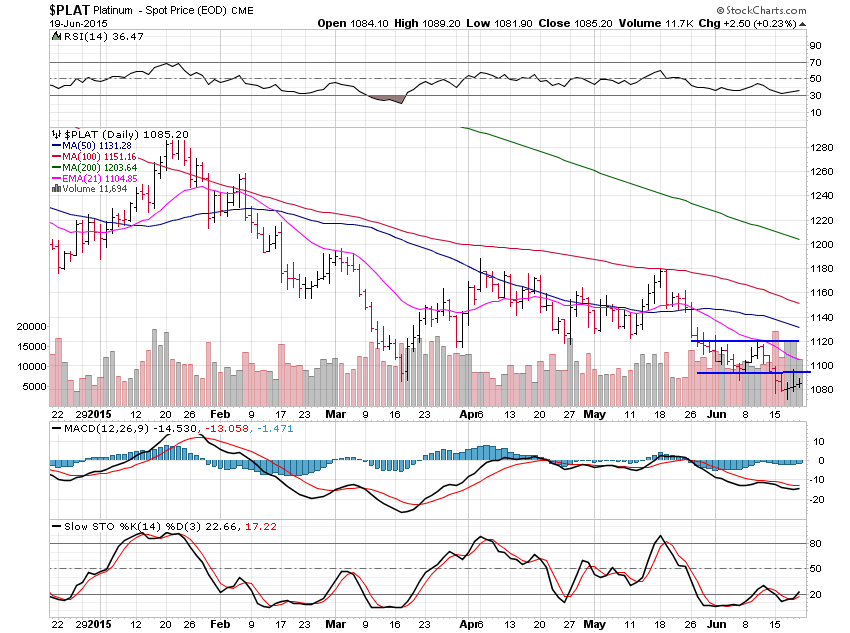
Platinum lost 0.90% this past week and is breaking below the small channel it had built over the prior two weeks or so.
There remains not too much support between here and $900 but that doesn’t mean it will be a quick move to that level.
There will be lots of bouncing around, but until the $900 area is hit, the dominant trend is most likely to remain down.

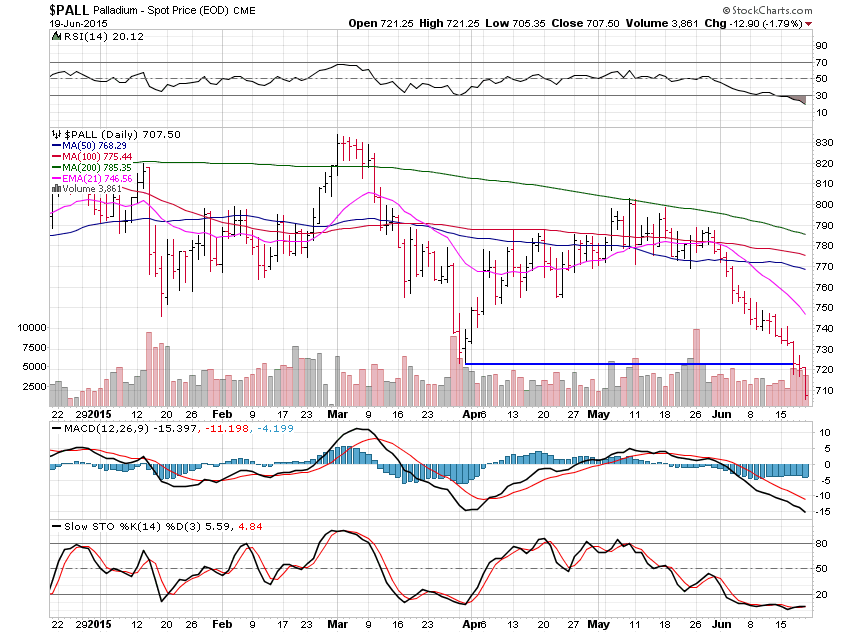
Palladium lost 3.98% and is breaking hard now after falling under the major support level at $725 which will now flip to a resistance level.
The next major support area remains at $550 and it looks like we may be able to get there by the end of the year at this rate but that is not a prediction, just a feeling.
I don’t predict, I just regurgitate what the charts tell me and they are right a very high percentage of the time.
I will be away next weekend so there will be no letter and I doubt I’ll put one out on the July 4th weekend unless there are some very special moves in the metals.