Key Points:
- Price action produces a false breakout.
- 60 EMA dynamic support is looming.
- Watch for a break lower in the coming week towards the $1230 an ounce mark.
The past six months have proved relatively positive for gold, as the metal has continued to make headway over a cooling U.S. domestic economy. However, the past few days have proved relatively illuminating for the metal, with a false breakout occurring above the trend line likely signaling a sharp pullback could be ahead. Subsequently, it remains to be seen if gold can retain its bullishness or whether a rout is, potentially, in progress.
It’s always the case that the retail money chases the high and the last few days, in precious metals, have largely proved that adage. As the large banks and financial institutions have been clamoring to get out of their positions, and have become largely net short via gold miners and derivatives, the retail trader has blundered into a bear trap.

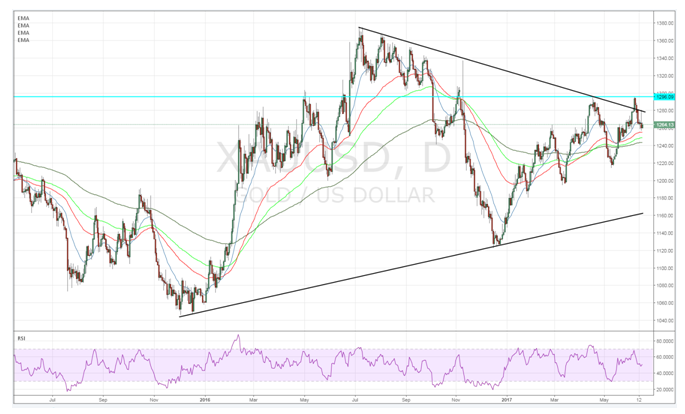
This effect is quite clearly seen on the daily chart with the false breakout above the short term declining trending line. As momentum started to stall, and the smart money exited their positions, gold saw plenty of spurious volume as retail traders sought to position long on the breakout. Unfortunately, the move stalled near the $1296.09 mark and we are left with price action now slipping steadily lower.
Subsequently, we are now left with the question of where to next for the precious metal given that markets have taken a relatively negative tone, following not only the false breakout, but also the FOMC decision. A quick technical analysis of the metal suggests that we could be in for some further falls given the fact that the RSI Oscillator remains within neutral territory and steadily trending lower. Additionally, price action is closing in on the 60 Day EMA and a break of this level could see a decline as deep as $1230 an ounce.
However, given the U.S. Fed’s recent commitment to economic tightening, gold could fundamentally be facing a much deeper fall. In fact, if the central bank follows through on their forward guidance to continue hiking rates, whilst tapering their balance sheet, we could see a deleterious decline that takes price action all the way to the bottom of the supporting trend line around $1140 an ounce.
Ultimately, the metal’s near term trend is clearly negative but it just remains to be seen whether gold experiences a soft or a hard landing. In the short term, at least, we are likely to see a fall-back towards $1230 an ounce over the next few weeks. Any further declines will require some fundamental variables to change and that remains at the behest of the Federal Reserve.
