The Federal Reserve took extraordinary steps to save the economy from slipping into a depression in 2007. There is little argument the economy was close to a financial cascade which was mitigated by direct actions by the Federal Reserve. Pundits are now coming out of the closets claiming they KNEW the extraordinary steps (such as quantitative easing) was not going to cause inflation because velocity of money was falling.
Follow up:
Velocity of money is defined as how fast money passes from one holder to the next.
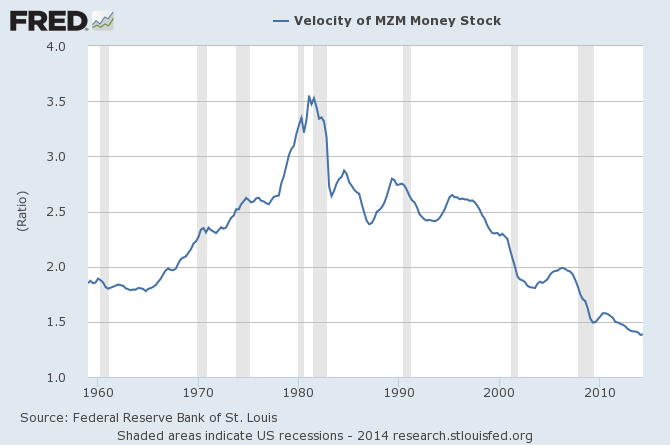
Using the MZM broad money, the velocity of money has fallen by over half since 1980 (graph above).
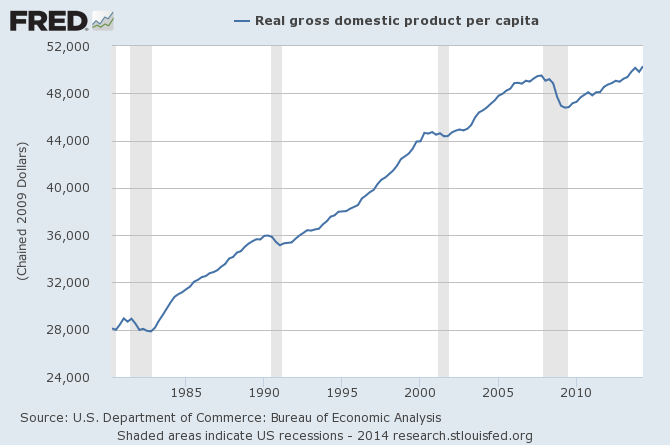
While inflation adjusted GDP per capita has almost doubled (graph above).
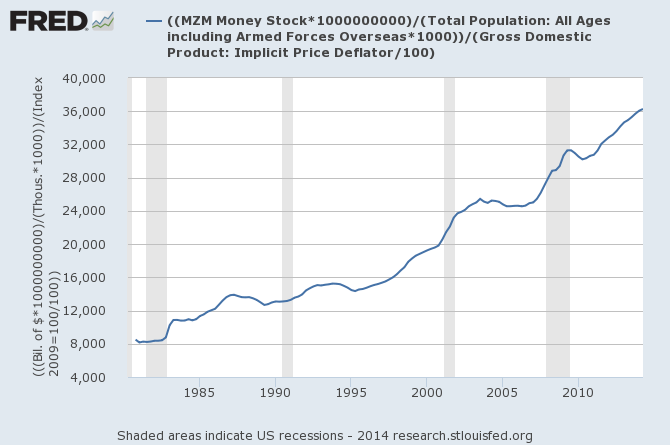
All while the money supply per capita has quadrupled (graph above).
[Note: There are many measures of money supply - M1, M2, M3 (discontinued), MZM, TMS1, and TMS2. The formula for determining velocity is V = (P)(T/M) where V = velocity, P = average prices, T = transactions, and M = money supply. A simpler velocity formula is using real GDP = P(T) with the shortened formula V = GDP/M. For those who believe I should have used M2 as the money supply the FRED graphs are (here) and (here).]
What a surprise that velocity of money has fallen in the recent period! You flood the economy with money, and velocity falls. Does it have anything to do with inflation? Velocity of money can rise or fall during periods of high inflation. Velocity can rise or fall during periods of low inflation / deflation.
Does velocity of money have anything to do with employment slack? Does it have anything to do with capacity utilization or commodity prices? Fiat currencies have unlimited supply ability if the Central Banks wishes. It is hard to imagine a Central Bank limiting the money supply unless they were looking to depress an economy.
Significant inflation occurs when economic slack begins to disappear. At one point in time when the USA was on the gold standard (with a semi-fixed money supply and no free trade agreements) - velocity of money was the canary in coal mine. Currently, the massive underutilization of labor in the USA puts downward pressure on inflation.
In today's globalized fiat world of push-button money creation - with:
- the dollar being the international currency of choice; and
- a great amount of dollar storage and transactions not being counted as they occur outside the USA but can easily slide in or out of the open borders;
Velocity of money discussions are useful for cocktail hour conversations.
Other Economic News this Week:
The Econintersect Economic Index for October 2014 is showing our index remaining in a tight growth range for over a half a year. Outside of our economic forecast - we are worried about the consumers' ability to expand consumption although data is now showing consumer income growing faster than expenditures - but with the rate of savings on the low side historically. There are no warning signs in other leading indices that the economy is stalling - although ECRI's Weekly Leading Index is showing very little growth is coming.
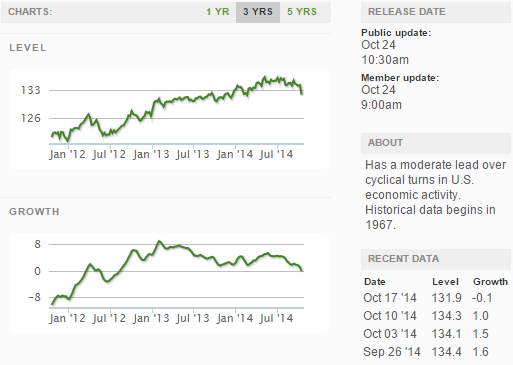
The ECRI WLI growth index value crossed over this week slightly into negative territory which implies the economy will not have grown six months from today.
Current ECRI WLI Growth Index
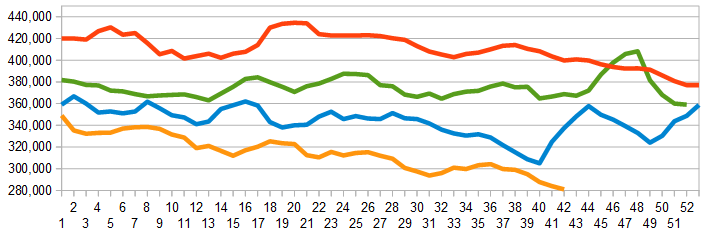
The market was expecting the weekly initial unemployment claims at 275,000 to 295,000 (consensus 285,000) vs the 283,000 reported. The more important (because of the volatility in the weekly reported claims and seasonality errors in adjusting the data) 4 week moving average moved from 284,000 (reported last week as 283,500) to 281,000.
Weekly Initial Unemployment Claims - 4 Week Average - Seasonally Adjusted - 2011 (red line), 2012 (green line), 2013 (blue line), 2014 (orange line)
Bankruptcies this Week: LDK Solar Systems
Click here to view the scorecard table below with active hyperlinks
Weekly Economic Release Scorecard:
