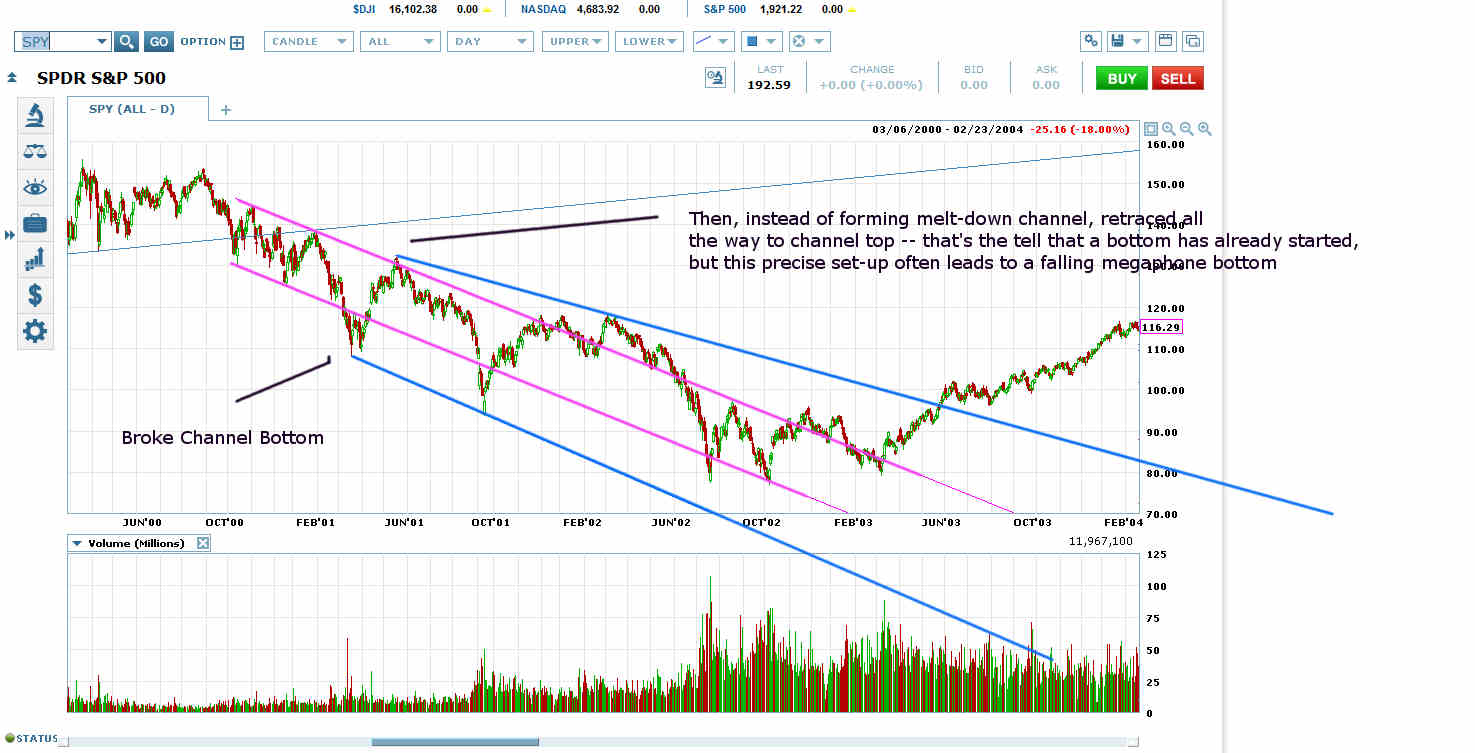
The Dot-Com Crash Started with a Price Channel (Pink) that Lead Into a Falling Megaphone Bottom (Blue)
There are targets, support areas and retrace requirements on the long-term ES and NYSE:SPY charts that suggest good odds of a large correction similar in structure to the one that started in 2000.
The 2000 correction started with a price channel (pink) that confirmed and then broke out downwards into a melt-down attempt.
But almost immediately after breakout, the price action signaled the start of a bottom by returning to the price channel top. Most price channel bottoms would then put in a slightly lower low within a sideways bottoming formation and break out its top to end the correction.
But there are other types of bottoming patterns that form when bulls jump the gun and a price has a lot farther to fall. A classic is the falling megaphone bottom, and that’s the pattern SPY and ES put in to complete the dot-com correction.
You tend to see falling megaphone bottoms when 1) bulls are overconfident, and 2) there are multiple topping formations on a long-term chart, each with a different target. Both conditions apply now.
You tend to see multiple topping formations in Sornette bubbles, and both the dot-com melt-up and recent QE melt-up were classic Sornette bubbles (based on the mathematical definition of Sornette bubbles). And both the 2000 and 2015 tops were characterized by combinations of long-term rising wedge tops and multiple nested H&S and megaphone topping formations, each with their own correction target.
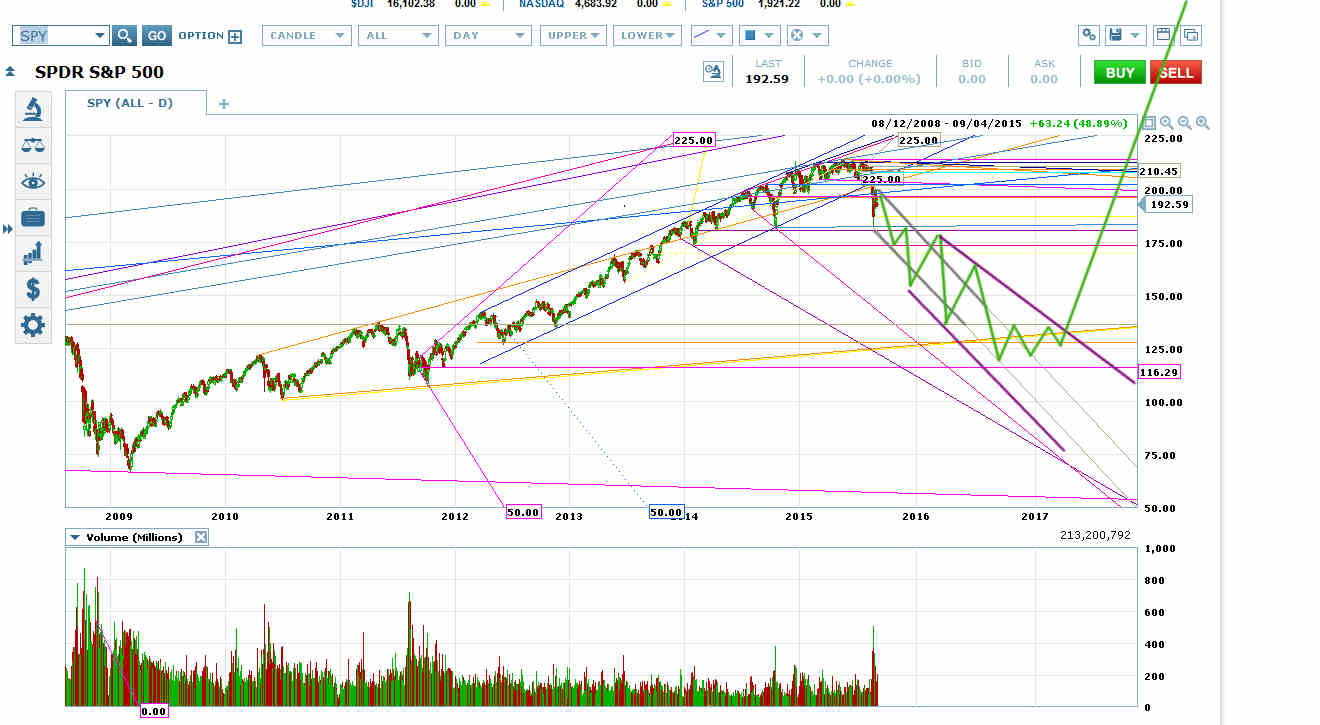
ES and SPY have already started a potential price channel with their sharp rallies out of the August 24 low, which are likely to be followed by a lower low with a target in the low 1700s. (See earlier posts for the NYMO lower low set-up.)
Potential 2015 Falling Megaphone Crash on SPY Chart
A bounce off the target area that reversed at the neckline of the big H&S on the chart would set up the potential gray price channel, which would need a lower channel low for confirmation.
SPY and ES have long-term rising megaphones (orange) on their chart that require a trip to at least their bottoms at roughly SPY 125 (they could break out downwards from the formation). But their conventional H&S targets are well above that SPY 125 level, which means they will probably see strong bounces before that target.
There will also be support at the 2011 high, which suggests another bounce.
This is a potential scenario, not an official trading set-up yet. There are still a lot of ways it could get cancelled. But it could be an official trading set-up in just another couple of price moves


