Crude oil moved sharply higher yesterday, almost touching the previous August highs, but it didn't manage to break above them. The resistance that we outlined in the previous Oil Trading Alerts kept the rally in check, and we already see the result. Crude oil simply declines. What's next? How far can it decline?
In short, the previous outlook remains up-to-date, simply because the situation developed in tune with what we wrote.
Of course, a daily rally appears bullish at the first sight, especially for the inexperienced traders, but this is a false signal. To be clear, a daily rally is not bearish on its own, but it's not enough to make the situation bullish either. Let's keep in mind that price tops have to - by definition - happen after a rally, not after a decline... So why is the something-rallied-so-it's-going-to-rally-again way of thinking so popular? It's easy to extrapolate the most recent trends into the future as that's what makes sense... Emotionally. And that's exactly what makes this business hard in the long run. To make money, one usually needs to act against what seems so obvious at the first sight.
The truth is that a daily rally is just a piece of information that investors and traders can use. And the way one uses it will determine if they will make money or not. How should one use it? As always, the context is the king. And what does the king tell us today?
Let's take a closer look at the charts below for details.

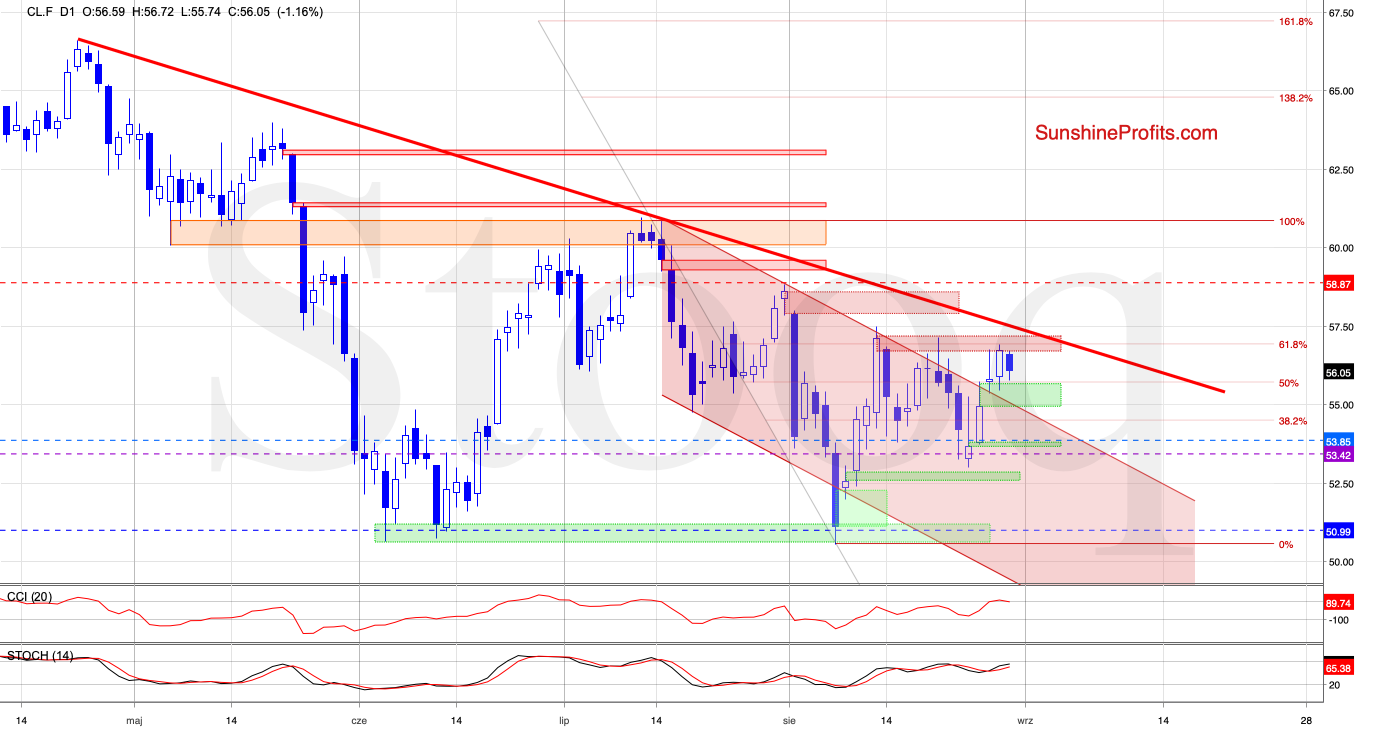
As far as the daily chart is concerned, in yesterday's Alert, we wrote the following:
Yesterday, crude oil tested the red resistance zone created by the previous peaks and further reinforced by the 61.8% Fibonacci retracement. While the bulls' unsuccessful break above it triggered a pullback, the commodity still closed the day above the Wednesday's green gap.
Earlier today, we saw another test of the green gap - the unsuccessful attempt to move lower translated into a rebound. This suggests that we could see a retest of the red resistance zone later in the day.
That's exactly what happened yesterday. We saw a retest and this retest failed. As you can see, the price is declining today.
Let's zoom in a bit.

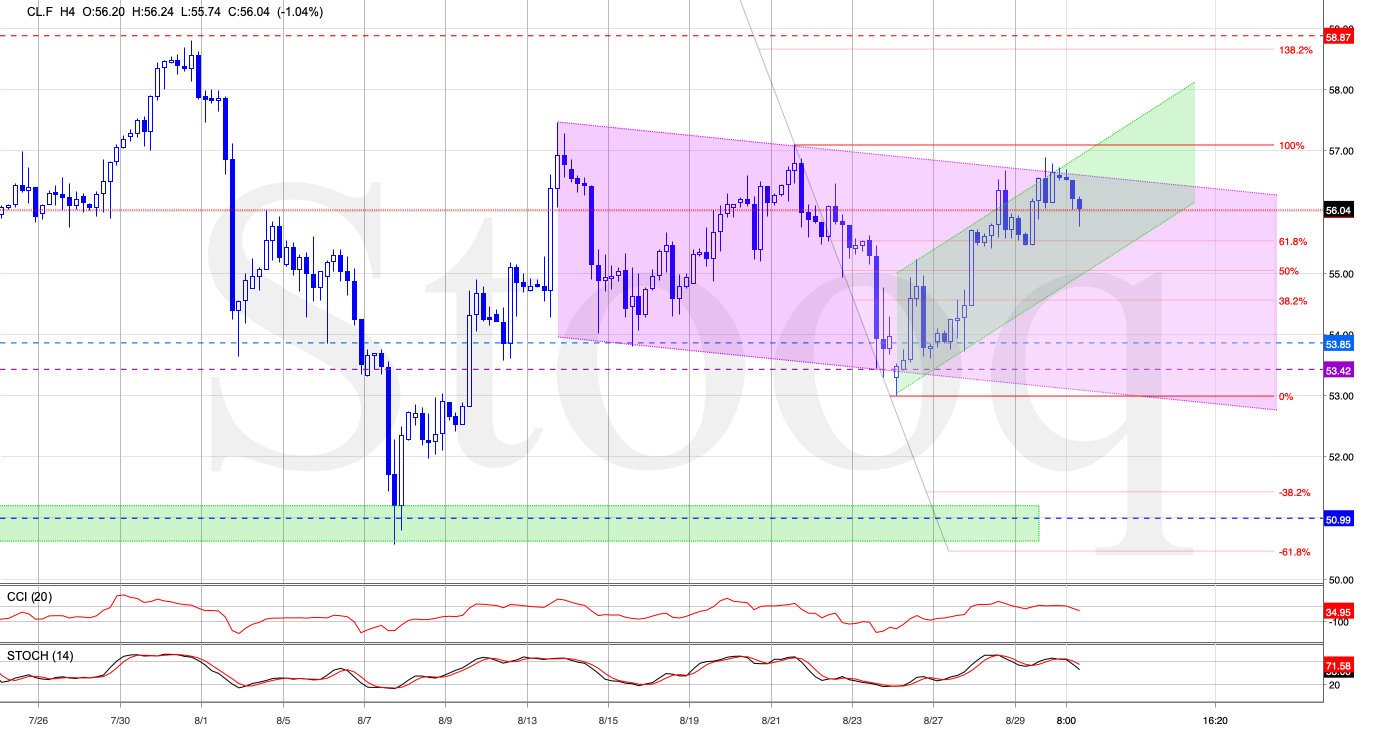
As far as the 4-hour chart is concerned, here's what we wrote:
The red zone is reinforced by the upper border of the declining purple trend channel and the upper border of the rising green trend channel of the 4-hour chart. These resistances combined with the position of the 4-hour indicators suggest a high likelihood of an upcoming reversal.
Where would the bears aim to take black gold then?
(...) Should the bulls fail to push prices higher (or should we see an invalidation of a potential breakout above the upper border of the channel), the sellers will likely take the reins. Then, crude oil futures can be expected to trade down to at least the lower border of the formation or even to the lower border of the purple declining trend channel and the recent lows.
That's exactly what happened. The tiny breakout above both trading channels was quickly invalidated, and price moved back into the purple trade channel, suggesting further declines.
Moreover, the sell signals generated by the 4-hours indicators suggest further deterioration in the coming day(s). They serve as the confirmation of the already-bearish case for crude oil.
The target is created by the lower border of the purple trend channel and the recent lows.
Summing up, oil bulls have once again been stopped at the red resistance zone and the 61.8% Fibonacci retracement, and they invalidated small breakouts above the short-term trade channels. This is a bearish combination that is further reinforced by sell signals from the indicators on the 4-hour chart. Consequently, the short position remains justified from the risk to reward point of view.
