Facebook (NASDAQ:FB) is scheduled to release its next earnings report on July 27, and consensus estimates suggest $6 billion in revenue and non-GAAP earnings of 81 cents per share. Multiple sources indicate that pricing trends were strong during the second quarter as advertisers enjoyed a higher return on their ad spend on the social network.
Return on investment on Facebook still growing
Nanigans released its second quarter Benchmark Report this morning, and the firm found that direct response marketers using its software are watching their returns rise. The average increase in return on ad spend among 20 of the highest-spending e-commerce and game advertisers using Nanigans’ software was 75%. Marketers are rewarding Facebook in a big way for that as the firm reports that the average increase in ad spend was 200%.
The firm found that e-commerce advertisers are gobbling up dynamic ads on Facebook with 14% more of their ad spend going to this type of ad during the second quarter compared to the previous quarter. Unsurprisingly, mobile continues play a huge role in e-commerce ad spend.

Meanwhile game advertisers are focusing on carousel ads, which drew 29% more ad spend among them in the second quarter.
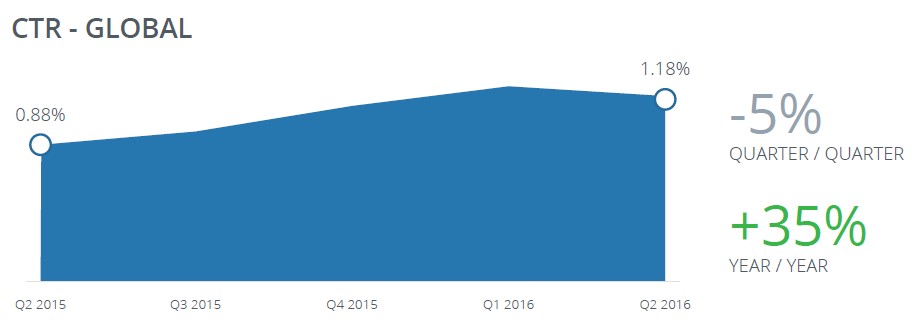
Nanigans reports that click-through rates dipped a bit sequentially but rose 35% year over year. This metric sits at the second-highest level the firm has observed since it began compiling its benchmark reports three years ago.

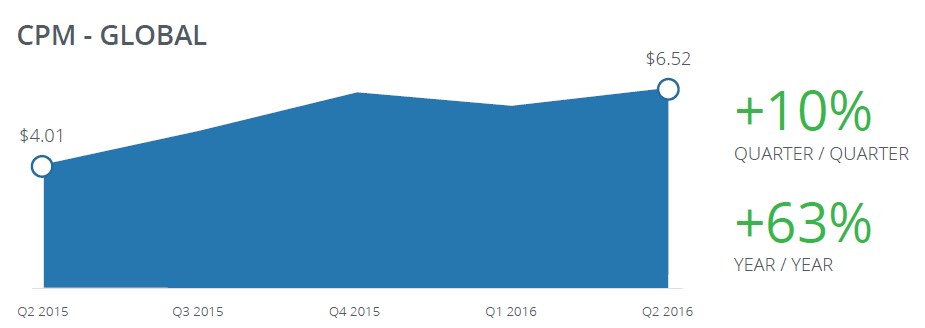
Cost per thousand impressions on Facebook continued to rise in the second quarter:


Goldman: only a small beat needed to drive strong reaction
Goldman Sachs (NYSE:GS) analyst Heather Bellini and team also said their checks on pricing trends for Facebook show strength and continuing Instagram traction during the second quarter. As a result, they see room for upside to the Street’s estimates. They had only been forecasting a 5% sequential increase in cost per thousand impressions for mobile, although as shown above, Nanigans estimates that cost per thousand impressions (not only mobile) increased 10% sequentially. Goldman adds that other sources indicated a rise of 3% to 8% quarter over quarter.
The firm said one Facebook partner said more than half of its customers were advertising on Instagram in the second quarter, compared to 40% of its customers in the fourth quarter. Bellini and team expects engagement to be a hot topic this quarter, particularly due to the rapid growth of Snapchat. They’re projecting 66.2% engagement, compared to 65.9% in the last quarter. Engagement is defined as daily versus monthly active users.
They added that investors don’t seem to be expecting a large beat for the second quarter, so they believe only a 2% beat or about $100 million would be enough to drive sentiment into positive territory. They continue to rate Facebook as a Buy with a $142 per share price target.
Facebook shares rose by as much as 1.24% to $122.11 during regular trading hours on Wednesday.
