Facebook Inc (NASDAQ:FB) Class A reports preliminary financial results for the quarter ended December 31, 2014.
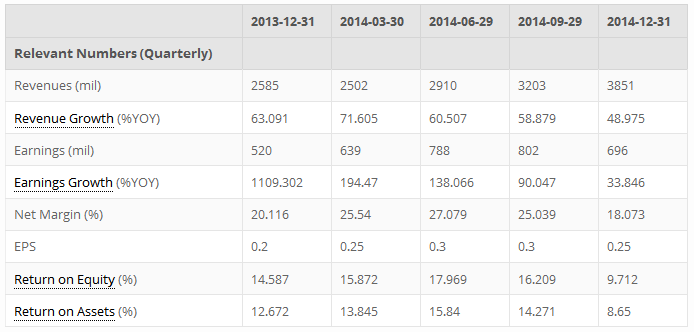
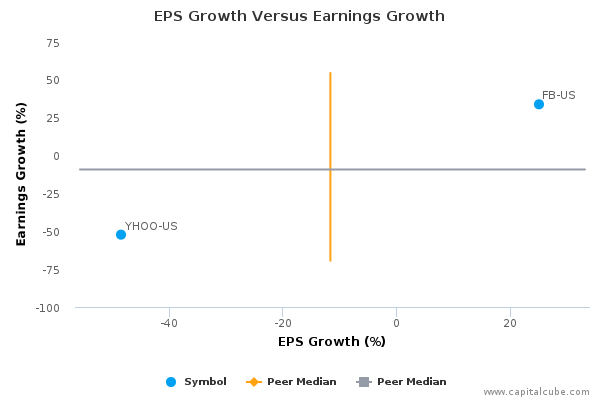
Facebook reported revenue of $3.85 B, up 49 percent compared to the prior year, and earnings of $696 million, up 34 percent. However, these increases came on the back of sharply higher expenses, which climbed about 87 percent. Much of that rise in expenses was attributable to Facebook’s expansion into video, and R & D expenses–which include compensation related to the purchase of messaging site Whatsapp. But the fact that CEO Mark Zuckerberg said expenses would stay high concerned investors.
Facebook has done a good job of monetizing its user base. It is collecting more ad dollars per user. Ad dollars per user grew 31 percent to $2.81 per user globally, or $9 per user in North America. However, most of Facebook’s user growth is outside North America region, where ad sending is much lower. This is a source for concern.
Facebook has also done a good job of keeping its enormous user base engaged. The ratio of daily active users to monthly active users was a stable 64 percent. There are 890 million daily active users, up 17 percent from a year ago. However, monthly active users grew at a slower pace than the same quarter last year. It is difficult to see where new users will come from as the market in North America and Europe is saturated, raising fears that the company’s fast growth may be ending.
Finally, Facebook seems to have mastered mobile and mobile advertising. 85 percent of users now access Facebook via mobile devices, and more than a third access it exclusively through mobile. Mobile now makes up 70 percent of revenue. The company predicts continued growth in mobile advertising and users, although high expenses are associated with that forecast.
Future growth for Facebook might come from video ads, e-commerce, Instagram, and Whatsapp.
This earnings release follows the earnings announcements from the following peers of Facebook, Inc. Class A – Yahoo! Inc. (YHOO-US).
Highlights
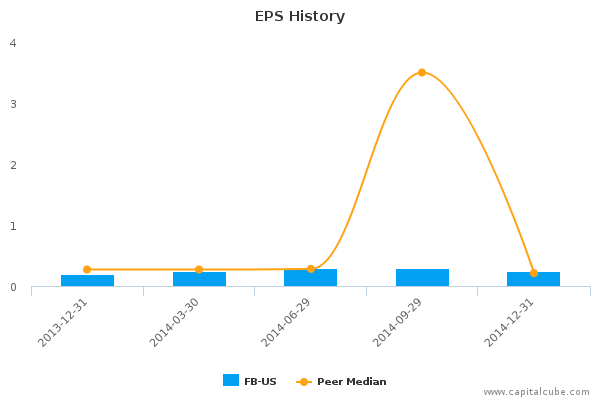
- Summary numbers: Revenues of $ 3.85 billion, Net Earnings of $ 696 million, and Earnings per Share (EPS) of $0.25.
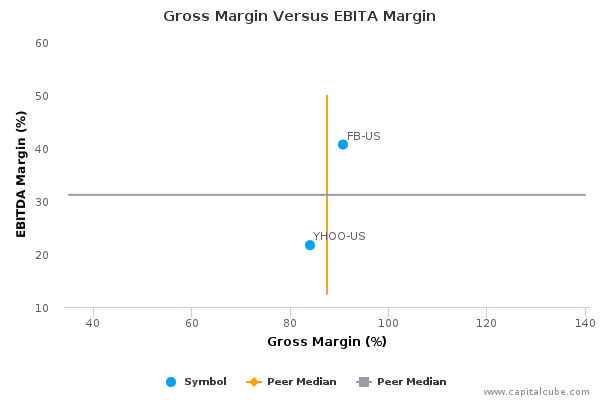
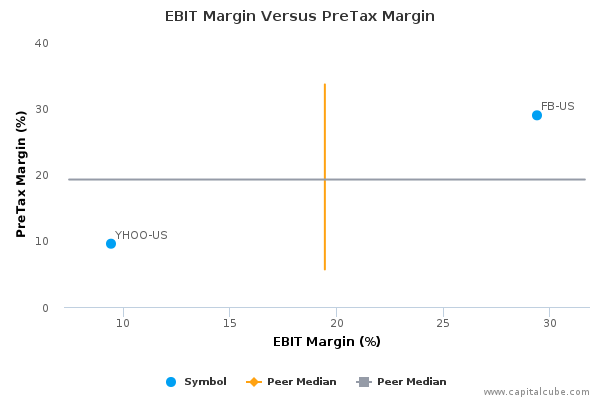
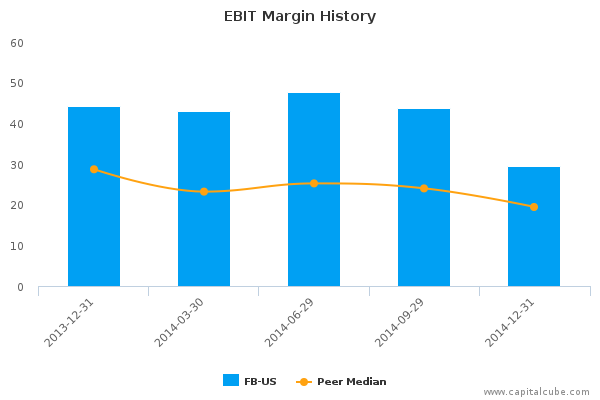
- Gross margins widened from 87.85% to 90.78% compared to the same quarter last year, operating (EBITDA) margins now 40.66% from 54.78%.
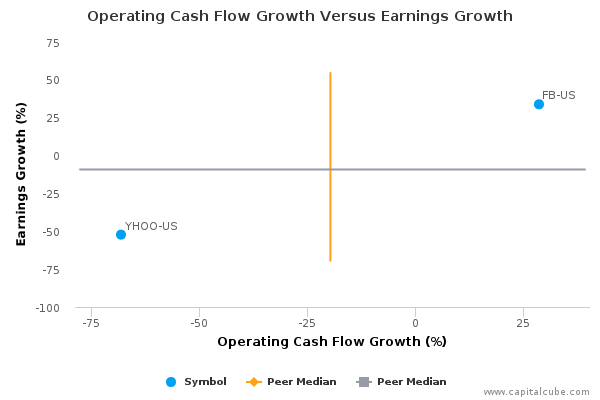
- Change in operating cash flow of 28.59% compared to same quarter last year trailed change in earnings, earnings potentially benefiting from some unlocking of accruals.
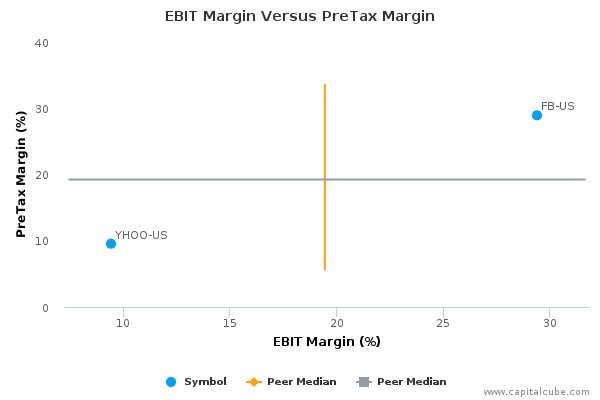
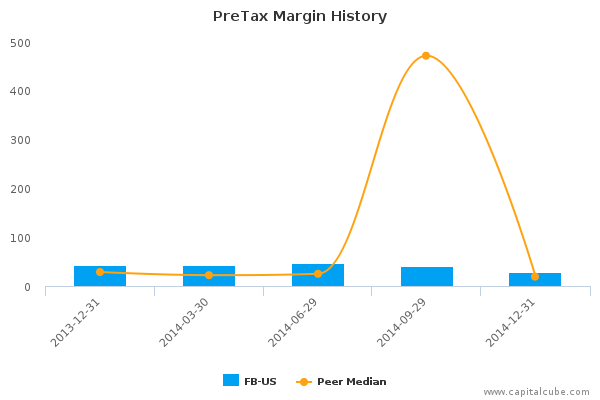
- Earnings rose compared to same quarter last year, despite decline in operating and pretax margins.
The table below shows the preliminary results and recent trends for key metrics such as revenues and net income growth:
Market Share Versus Profits
Companies sometimes focus on market share at the expense of profits or earnings growth.
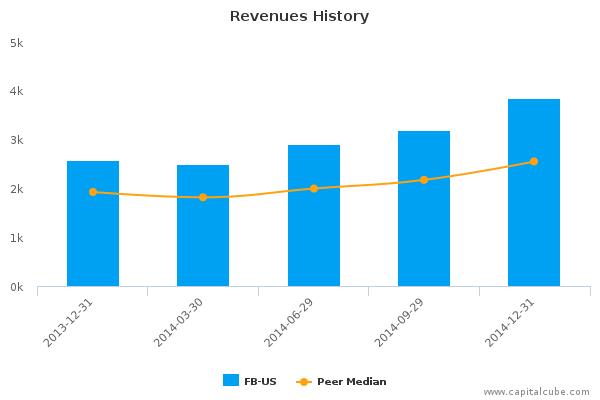
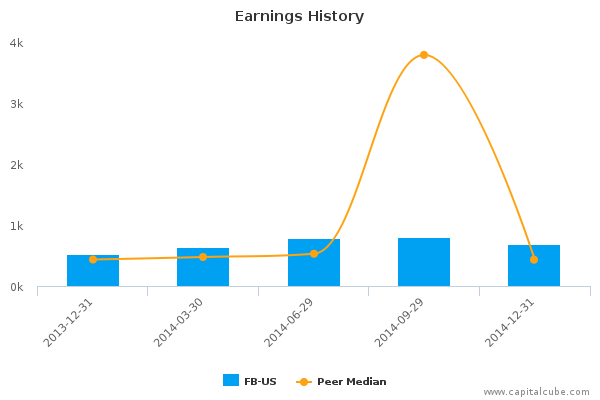
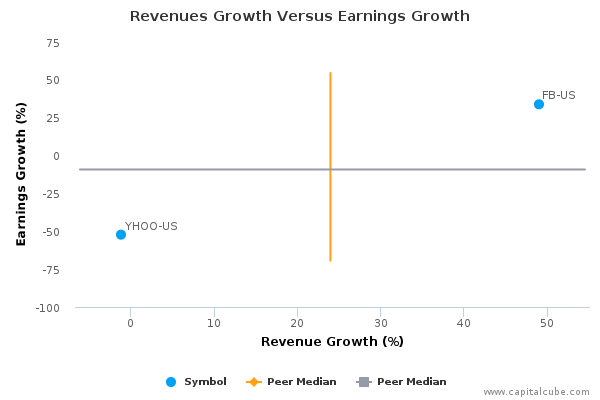
Compared to the same quarter last year, FB-US's change in revenue of 48.97% surpassed its change in earnings, which was 33.85%. This suggests perhaps that FB-US's focus is on market share at the expense of bottom-line earnings. However, this change in revenue is better than its peer average, pointing to perhaps some longer lasting success at wrestling market share from its competitors, and helping Capital Cube look past its weaker earnings performance this period. Also, for comparison purposes, revenues changed by 20.23% and earnings by -13.22% in the quarter ended September 30, 2014.
Earnings Growth Analysis
The company's earnings growth has been influenced by the year-on-year improvement in gross margins from 87.85% to 90.78%. However the company's overhead costs have prevented it from fully capitalizing on these gross margin improvements. In fact, the company's operating margins (EBITDA margins) showed no improvement over the same period last year.
Gross Margin Trend
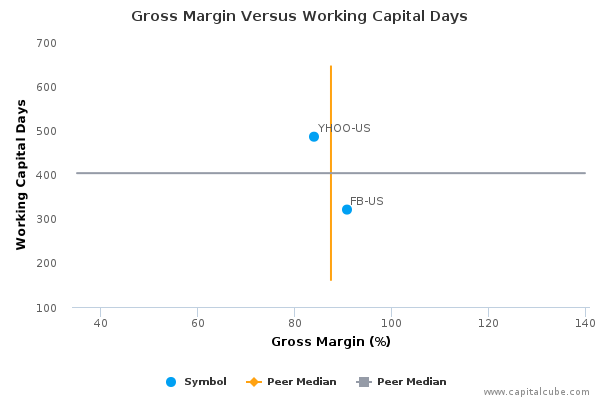
Companies sometimes sacrifice improvements in revenues and margins in order to extend friendlier terms to customers and vendors. Capital Cube probes for such activity by comparing the changes in gross margins with any changes in working capital. If the gross margins improved without a worsening of working capital, it is possible that the company's performance is a result of truly delivering in the marketplace and not simply an accounting prop-up using the balance sheet.
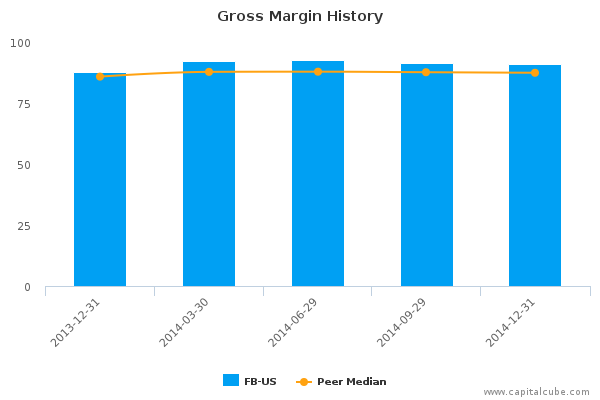
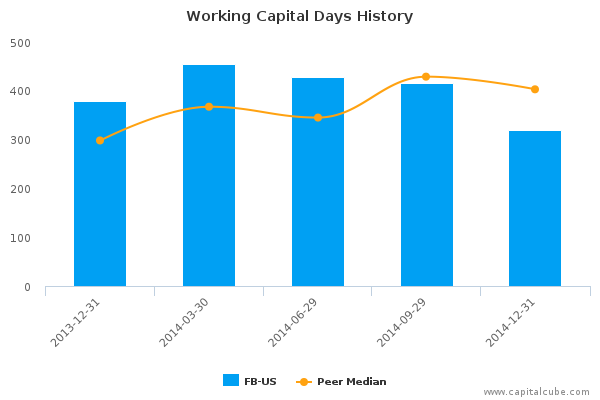
FB-US's improvement in gross margin has been accompanied by an improvement in its balance sheet as well. This suggests that gross margin improvements are likely from operating decisions and not accounting gimmicks. Its working capital days have declined to 320.51 days from 379.05 days for the same period last year.
Cash Versus Earnings – Sustainable Performance?
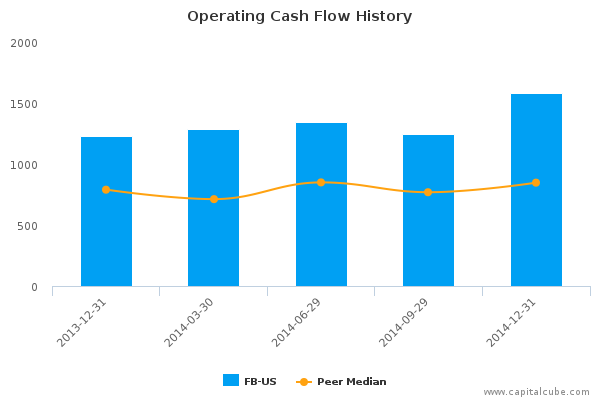
FB-US's year-on-year change in operating cash flow of 28.59% trailed its change in earnings. This leads Capital Cube to question whether the earnings number might have been achieved from some unlocking of accruals. In addition, the increase in operating cash flow was less than the average announced thus far by its peer group.
Margins
Despite a decline in operating (EBIT) margins as well as a decline in pretax margins, the company's earnings rose.
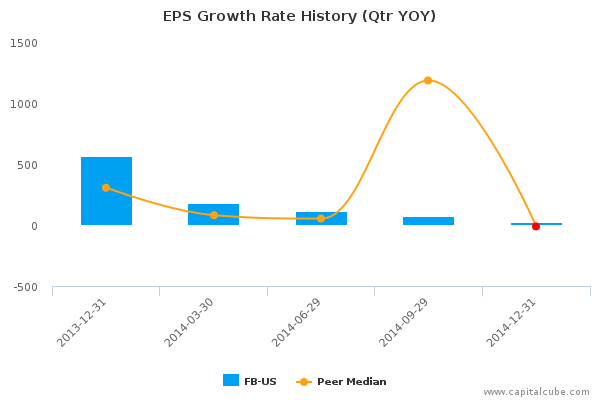
EPS Growth Versus Earnings Growth
Company Profile
Facebook, Inc. is a social networking service and website. It aims to make the world more open and connected. People use Facebook to stay connected with their friends and family, to discover what is going on in the world around them, and to share and express what matters to them to the people they care about.. The company offers advertisers a unique combination of reach, relevance, social context, and engagement to enhance the value of their ads. Its services include timeline, news feed, messages, lists, ticker and mobile apps. Facebook was founded by Mark Elliot Zuckerberg, Dustin Moskovitz, Chris R. Hughes and Eduardo Saverin on February 4, 2004 and is headquartered in Menlo Park, CA.
Original post
