📈 69% of S&P 500 stocks beating the index - a historic record! Pick the best ones with AI.See top stocks

Facebook Reached The $155 Target: What's Next?

Published 06/11/2017, 02:03 PM
Updated 07/09/2023, 06:31 AM
META
-


Last week I showed that Facebook (NASDAQ:FB) would reach around $155 and start correcting from there: see here. On Friday it reached $155.54 and dropped 5.8% intra-day, to end the day down 3.28%. It's largest intra-day drop since November 2016.

To illustrate: if you'd bought FB late-April your gains would effectively be $0... So much for buy, hold and hope. Clearly accurate Elliott Wave analyses combined with solid technical analysis and executing a proven trading system provides for much more reliable and profitable trading: see here.

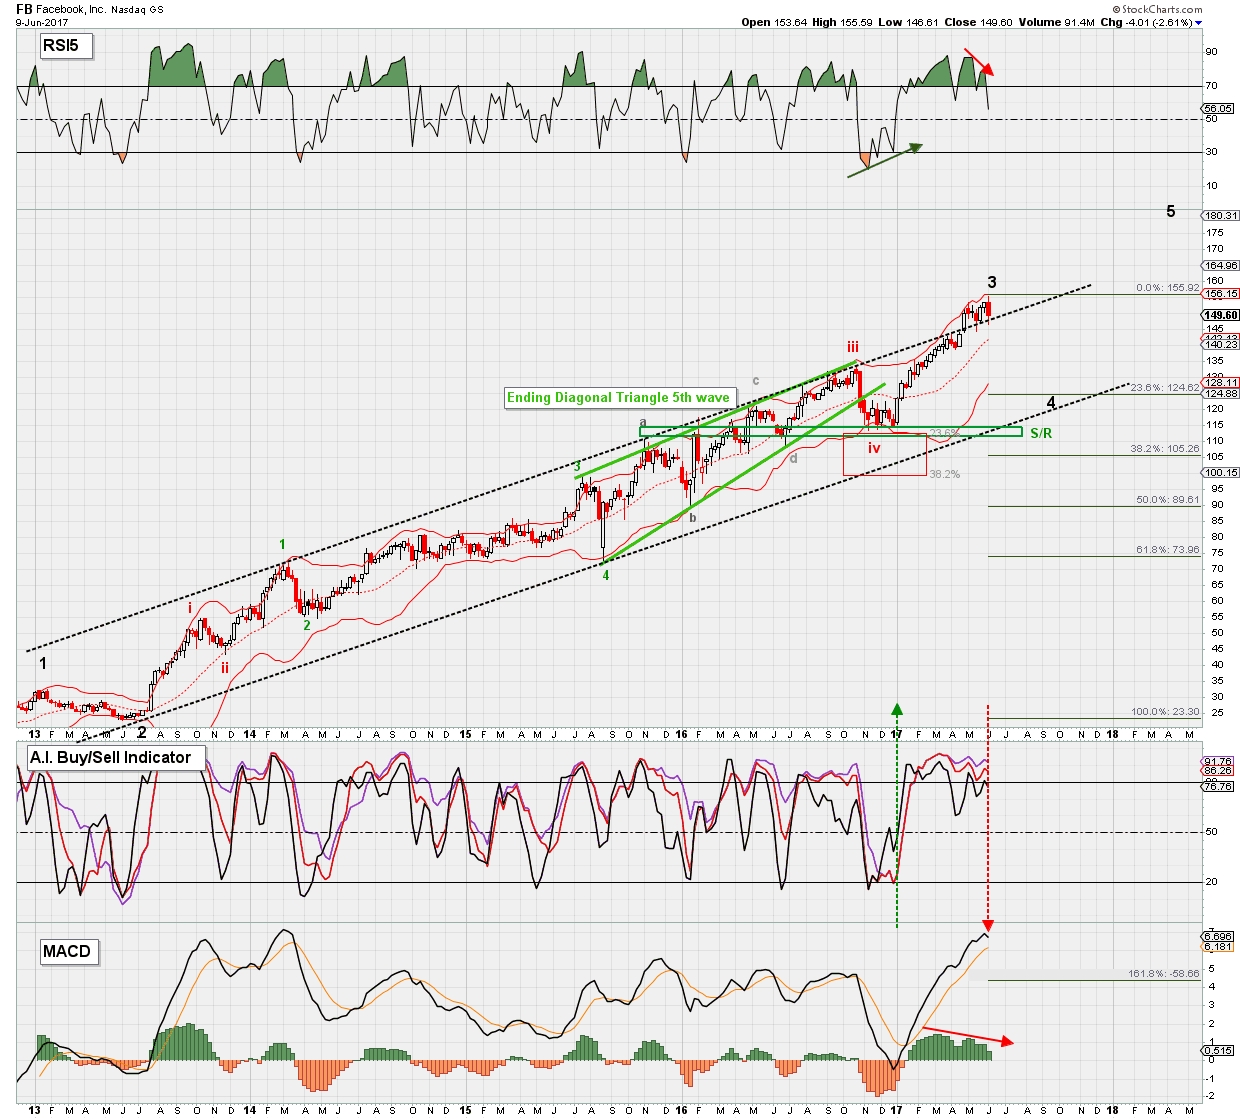
That said, where's FB heading next? The weekly chart below tells the most likely story. Please note this chart has barely changed from what I already showed December last year here on Investing.com, when I correctly forecasted FB was becoming a low risk/high reward buy: see here.

Facebook weekly candlestick chart

Although one more push higher can not yet be excluded until price drops below the mid-May low @ $144ish, so please keep an eye on that level, the number of waves up can be counted as an complete impulse (5 waves) off the December 2016 low, and thus the risk/reward is to the downside, not the upside.

I now expect FB to retrace 23.6 to 38.2% of its entire advance off the price low made in 2013: $125-$105 should be the ultimate target. This retrace levels are typical for a 4th wave and therefore the most reasonable to forecast. In addition, the $110-$115 level is now a good support zone and the rising dotted black trend line is currently within that region as well.

Please note that 4th waves are notoriously difficult to forecast and trade as there are no set rules. They can turn into high-level consolidations (bull flag), or fast steep drops. Regardless, FB, like many other large-cap tech stocks is getting closer to the end then the beginning of their long multi-year uptrends and it would not be unwise for long-term traders to start to re-evaluate their holdings and positions in these names.

Latest comments

Loading next article…
Risk Disclosure: Trading in financial instruments and/or cryptocurrencies involves high risks including the risk of losing some, or all, of your investment amount, and may not be suitable for all investors. Prices of cryptocurrencies are extremely volatile and may be affected by external factors such as financial, regulatory or political events. Trading on margin increases the financial risks.
Before deciding to trade in financial instrument or cryptocurrencies you should be fully informed of the risks and costs associated with trading the financial markets, carefully consider your investment objectives, level of experience, and risk appetite, and seek professional advice where needed.
Fusion Media would like to remind you that the data contained in this website is not necessarily real-time nor accurate. The data and prices on the website are not necessarily provided by any market or exchange, but may be provided by market makers, and so prices may not be accurate and may differ from the actual price at any given market, meaning prices are indicative and not appropriate for trading purposes. Fusion Media and any provider of the data contained in this website will not accept liability for any loss or damage as a result of your trading, or your reliance on the information contained within this website.
It is prohibited to use, store, reproduce, display, modify, transmit or distribute the data contained in this website without the explicit prior written permission of Fusion Media and/or the data provider. All intellectual property rights are reserved by the providers and/or the exchange providing the data contained in this website.
Fusion Media may be compensated by the advertisers that appear on the website, based on your interaction with the advertisements or advertisers.
© 2007-2024 - Fusion Media Limited. All Rights Reserved.