
Monday is a slow news day for economic releases, which provides an opportunity for a quick review of the momentum factor in three currency pairs: EUR/USD, EUR/GBP, USD/JPY. A few weeks ago I profiled this trio and their respective 20-day return histories through time. It is always helpful to periodically revisit a given analytical methodology and how it compares after the fact on the assumption that progress in estimating future values for currencies (or any other data series) is a learning process rather than a reliable point forecast.
EUR/USD: On December 16, I wrote that EUR/USD "still has room to run higher," based on the historical perspective for a 20-day trading horizon. The reasoning was that most (97%) of EUR/USD's rolling 20-day return histories for the previous 10 years are contained within a +/-6 percent performance band. True, but I should have also mentioned that a +/-4 percent performance band captured almost as much (86%) of the fluctuations over the past decade. As it turns out, the +/-4 percent band was a short-term ceiling. EUR/USD's 20-day return topped out around a 3 percent gain recently and has been sliding in the new year.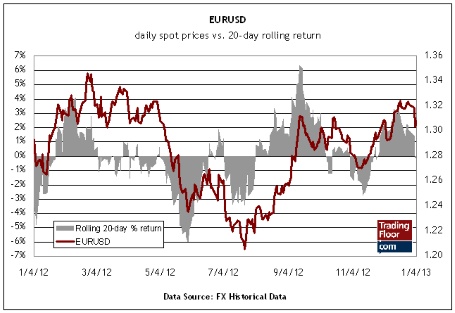 EUR/USD" title="EUR/USD" width="455" height="313">
Deciding where and when a trading position has run its course is never easy, but we can benefit from a number of empirical facts in forex, starting with the persistence of momentum. Relying on one metric alone for assessing momentum is problematic, but studying historical return patterns is usually a good start. Assuming a 20-day trading horizon, for example, implies that we should be increasingly cautious whenever returns move into the outer range of historical experience. But it is also prudent to look for confirmation, or rejection, from several methodologies for a richer read on estimating expected return.
Analysing the trend via several technical analysis filters is one possibility. That includes reviewing the +/- percentage deviation for the latest price versus a 20-day moving average of those prices. Looking at EUR/USD through this analytical lens implies that the outlook is relatively neutral compared with the last several weeks.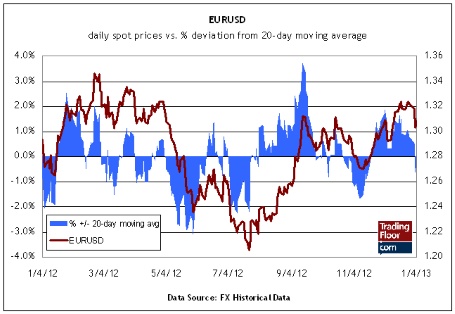 EUR/USD 2" title="EUR/USD 2" width="455" height="314">
EUR/GBP: My previous comments on EUR/GBP also failed to mention that a tighter performance band of +/-2 percent cannot be ignored, given its history of representing the upper and lower range of 20-day returns for 80 percent of these rolling periods over the past decade. This turned out to be a hard mark for EUR/GBP recently, which has hit some headwinds lately. The 20-day return has fallen to virtually nil as of Friday. The percentage deviation in the EUR/GBP's current price relative to its 20-day average is also hovering around zero. The message here too is that the momentum signals look considerably closer to neutral compared with late-December.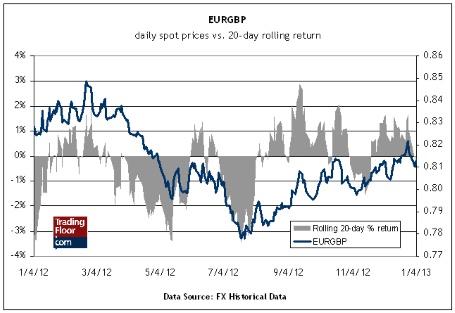 EUR/GBP" title="EUR/GBP" width="455" height="313">
USD/JPY: It is another story for USD/JPY, which has been in a powerful rally lately. Last month I noted that USD/JPY was closing in on its historical upper range for 20-day returns, which suggested caution. The observation looked relevant for a few days after my December 16 post, but then events intervened with the late-December installation of a new prime minister in Japan. As we all know, Shinzo Abe is leading the charge for a substantially more aggressive round of monetary stimulus, which has weakened the yen lately.
The bottom line: USD/JPY has continued to rally, with the 20-day return pushing higher into rarefied performance territory for this time horizon. As of January 4, USD/JPY is up 7.5 percent over the past 20 days. Since the end of 2002, 7 percent-plus returns have occurred only 0.6 percent of the time for 20-day rolling periods. The +/- percentage deviation in the current price versus its 20-day average also confirms that recent performance is in the outer range for positive returns for the past decade.
USD/JPY could run higher still, of course. So, what is the value of quantitatively profiling momentum and other aspects of trading histories? Perspective. If USD/JPY's track record reveals a slim 0.6 percent frequency of 20-day returns north of 7 percent, the implication is that betting on returns over that level will be a losing proposition 99.4 percent of the time. That is not necessarily going to help you on the next trade, of course. On the other hand, that is a considerably more informative piece of information if you are designing a trading system that has a decent chance of surviving the test of time.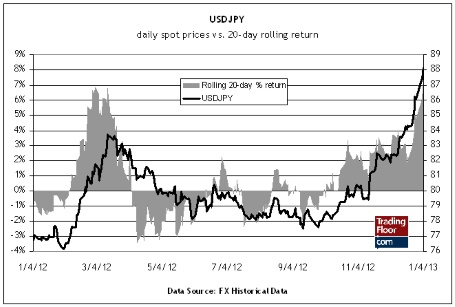 USD/JPY" title="USD/JPY" width="455" height="307">
- English (UK)
- English (India)
- English (Canada)
- English (Australia)
- English (South Africa)
- English (Philippines)
- English (Nigeria)
- Deutsch
- Español (España)
- Español (México)
- Français
- Italiano
- Nederlands
- Português (Portugal)
- Polski
- Português (Brasil)
- Русский
- Türkçe
- العربية
- Ελληνικά
- Svenska
- Suomi
- עברית
- 日本語
- 한국어
- 简体中文
- 繁體中文
- Bahasa Indonesia
- Bahasa Melayu
- ไทย
- Tiếng Việt
- हिंदी
Eyes On EUR/USD, EUR/GBP, USD/JPY Levels: January 7, 2013
Published 01/07/2013, 01:28 AM
Updated 03/19/2019, 04:00 AM
Eyes On EUR/USD, EUR/GBP, USD/JPY Levels: January 7, 2013
Latest comments
Loading next article…
Install Our App
Risk Disclosure: Trading in financial instruments and/or cryptocurrencies involves high risks including the risk of losing some, or all, of your investment amount, and may not be suitable for all investors. Prices of cryptocurrencies are extremely volatile and may be affected by external factors such as financial, regulatory or political events. Trading on margin increases the financial risks.
Before deciding to trade in financial instrument or cryptocurrencies you should be fully informed of the risks and costs associated with trading the financial markets, carefully consider your investment objectives, level of experience, and risk appetite, and seek professional advice where needed.
Fusion Media would like to remind you that the data contained in this website is not necessarily real-time nor accurate. The data and prices on the website are not necessarily provided by any market or exchange, but may be provided by market makers, and so prices may not be accurate and may differ from the actual price at any given market, meaning prices are indicative and not appropriate for trading purposes. Fusion Media and any provider of the data contained in this website will not accept liability for any loss or damage as a result of your trading, or your reliance on the information contained within this website.
It is prohibited to use, store, reproduce, display, modify, transmit or distribute the data contained in this website without the explicit prior written permission of Fusion Media and/or the data provider. All intellectual property rights are reserved by the providers and/or the exchange providing the data contained in this website.
Fusion Media may be compensated by the advertisers that appear on the website, based on your interaction with the advertisements or advertisers.
© 2007-2024 - Fusion Media Limited. All Rights Reserved.